

Project Home
Description
Section titled “Description”Project home is where you start in a project. A rail on the left lists seven pages, as text with no icons: Overview, Variables, Schedules & sensors, Access & sharing, Data & connections, Data model and Apps & branding. Overview summarizes the project. The other six pages are where you change the project’s settings or, on Data model, see which columns its tables share.
The Variables badge on the rail shows how many variables the project has. The Schedules & sensors badge shows how many schedules and sensors are active. The Data model badge shows how many project elements there are.
A locked project is read only. Its pages show a banner that says “This project is locked, so it is read only. Unlock it on Overview to make changes.” and their controls are disabled.
Overview
Section titled “Overview”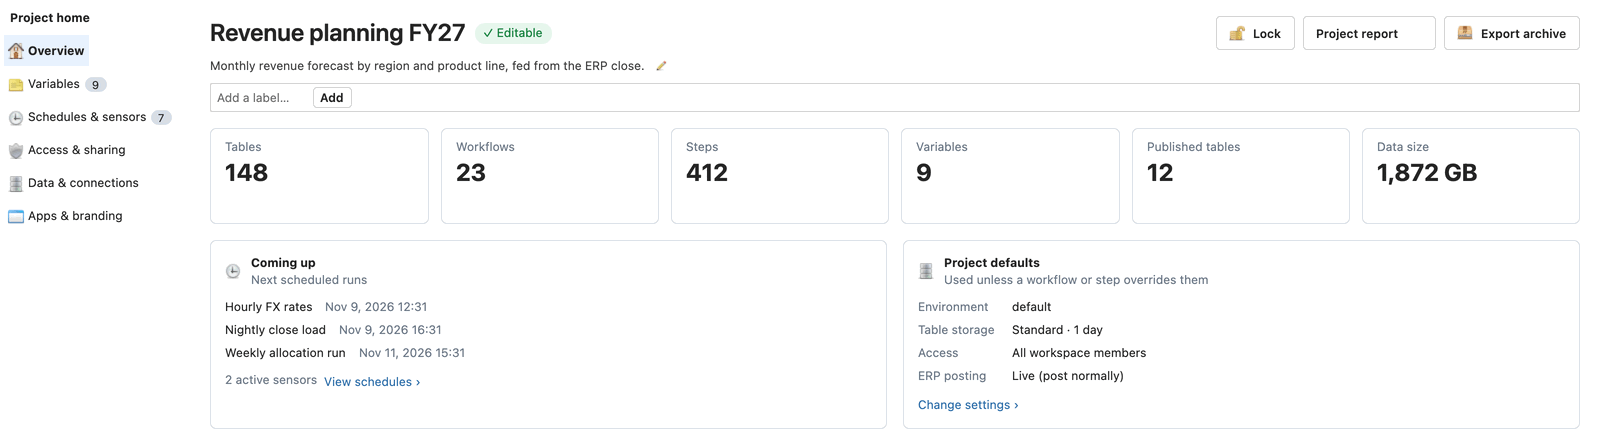
The top of the page shows the project name and whether it is Editable or Read only.
- Description. Click the pencil to edit the description in place. Press Enter to save, or Escape to cancel.
- Labels. Type a label in Add a label… and click Add. See Organizing Work with Labels.
- Lock and Unlock switch the project between editable and read only.
The tiles count what the project holds:
| Tile | Shows |
|---|---|
| Tables | Tables in the project. |
| Workflows | Workflows in the project. |
| Steps | Steps across all workflows. |
| Variables | Project variables. |
| Published tables | Tables you have published. |
| Data size | Everything the project stores, including earlier versions kept so you can restore data. It is the same figure as the project’s Size on the Projects screen. Hover over it to see current data and earlier versions kept for restore separately. Click it to open Storage. See Managing Storage. |
If some of the project’s rows are filtered for you, Data size shows a dash because the total would not be accurate.
Coming up lists the next three scheduled runs with their workflow names, and the number of active sensors. View schedules › opens Schedules & sensors.
Project defaults shows the Environment, Table storage, Access and ERP posting values that workflows and steps use unless they set their own. Change settings › opens the page where you change them.
The header buttons are:
- Project report builds a report of the project as a PDF Document or Interactive HTML.
- Export archive saves the project as an archive.
- Refresh reloads the tiles and the lists on the page.
Variables
Section titled “Variables”The Variables page lists the project’s variables in a grid. A workflow or step refers to a variable by name as {name}, and a workflow’s own variable overrides a project variable of the same name.
The grid shows Name, Value, Memo, Last updated and By. Use Filter to narrow the list, New variable to add one, and Edit or Delete for the selected row.
Schedules & Sensors
Section titled “Schedules & Sensors”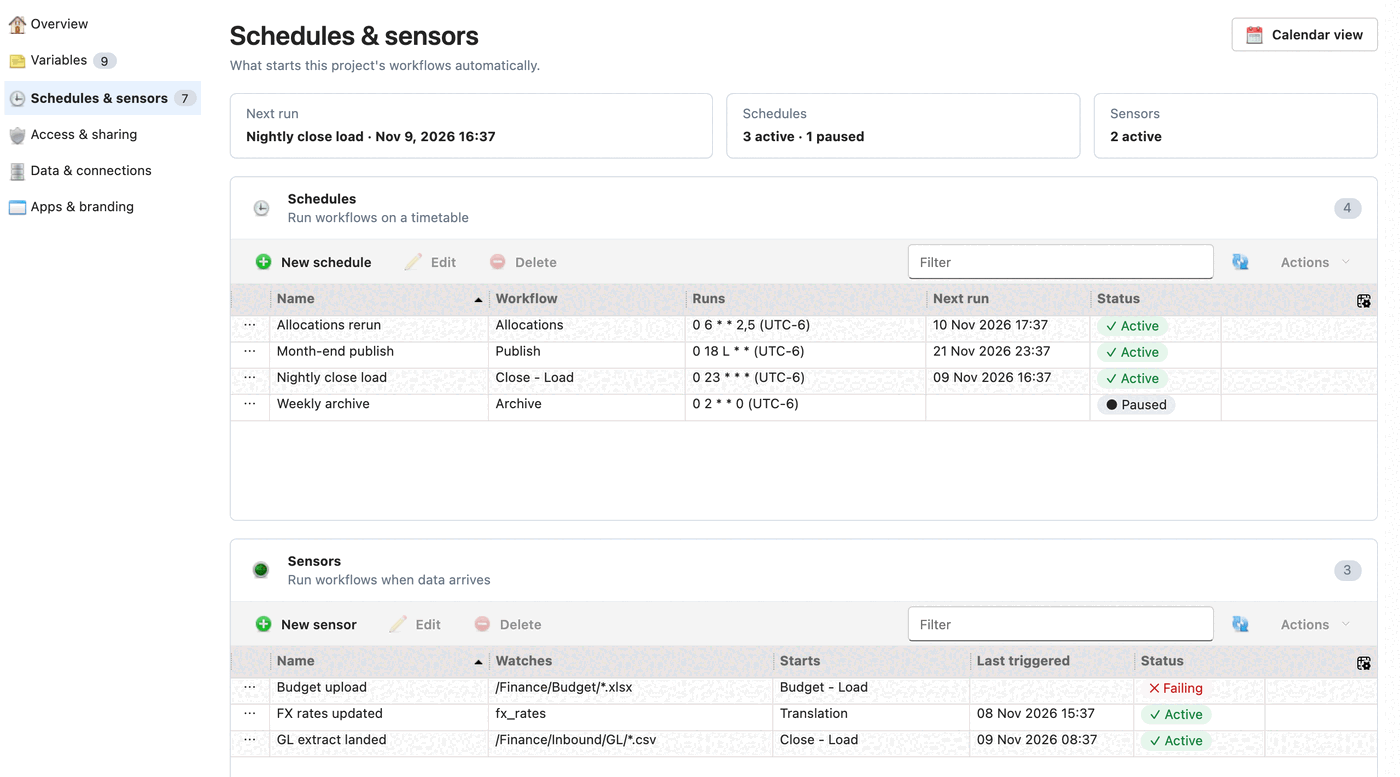
This page shows what starts the project’s workflows automatically. A summary strip shows the next run, the number of active and paused schedules, and the number of active sensors.
- Schedules run a workflow on a timetable. The grid shows Name, Workflow, Runs (the timetable and its time zone), Next run and Status.
- Sensors run a workflow when new data arrives. The grid shows Name, Watches, Starts (the workflow), Last triggered and Status.
Status is Active, Paused or, for a sensor that has a problem, Failing. Each grid has New schedule or New sensor, Edit, Delete and Filter. Open Actions to Activate or Deactivate the selected row.
Calendar view shows upcoming runs on a calendar, so you can spot scheduling conflicts.
Access & Sharing
Section titled “Access & Sharing”This page sets who can reach the project and its data.
- Project access sets Who can open this project: All Workspace Members, Specific Security Groups Only or Specific Members Only. Edit groups › and Edit members › open the lists to choose from.
- Dashboard audience sets the Default audience for new dashboards: everyone in the project, or specific groups. Each dashboard can change its own audience. See Control Who Can See a Dashboard.
- Data shares lists the projects that can read tables from this one. See Sharing Data Between Projects.
Data & Connections
Section titled “Data & Connections”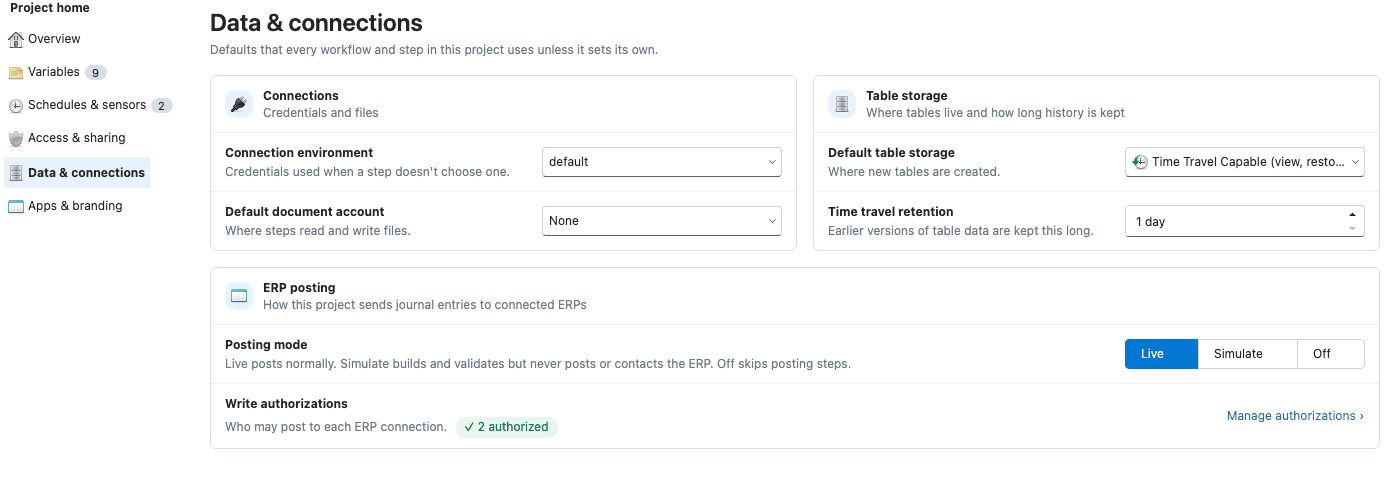
These settings apply to every workflow and step in the project unless a workflow or step sets its own.
- Connection environment chooses which of each connection’s configurations the project’s steps use, so one project can move between QA and Production. Every step follows it unless the step has a fixed environment. When you change it, the page warns you if a connection in the project has no configuration for the new environment, and names the steps whose fixed environment won’t follow.
- Default document account chooses where steps read and write files.
- Default table storage chooses where new tables are created.
- Time travel retention sets how many days earlier versions of table data are kept. Tables that inherit this setting keep longer history too. History that has already expired can’t be recovered.
- Posting mode sets how the project sends journal entries to connected ERPs. It is a ceiling for the project: a workflow run can’t post more permissively than this setting. Live posts normally. Simulate builds and validates but never posts or contacts the ERP. Off skips posting steps.
- Write authorizations shows how many ERP connections are authorized for posting. Administrators can click Manage authorizations ›.
Data Model
Section titled “Data Model”This page lists the project’s elements: column names its tables share, described once. It shows which tables share each element, and lets you create, change and delete elements. See Data Model and Project Elements.
Apps & Branding
Section titled “Apps & Branding”This page covers the apps built on the project’s data.
- Panel apps shows how many apps are built on the project. Open Panel apps › opens them, and New studio app starts one.
- Branding sets the logo and colors the project’s apps use. Edit branding › opens the settings.
- Home tile image is the picture shown on the project’s tile on the Home page. Click Choose… to pick an image, or Clear to remove it.