This is the multi-page printable view of this section. Click here to print.
Table Steps
- 1: Table Anti Join
- 2: Table Append
- 3: Table Clear
- 4: Table Copy
- 5: Table Cross Join
- 6: Table Drop
- 7: Table Extract
- 8: Table Faker
- 9: Table In-Place Delete
- 10: Table In-Place Update
- 11: Table Inner Join
- 12: Table Lookup
- 13: Table Melt
- 14: Table Outer Join
- 15: Table Pivot
- 16: Table Union All
- 17: Table Union Distinct
- 18: Table Upsert
1 - Table Anti Join
Description
Table Anti Join provides the unmatched set of items between two tables. This will return the list of items in the first table without matches in the second table. This can be quite useful for determining which records are present in one table but not another.
This operation could be accomplished by using outer joins and filtering on null values for the join; however, the Anti Join transform will perform this in a more efficient and obvious way.
Table Data Selection
Table Source
Specify the source data table by selecting it from the dropdown menu.
Source Columns
Specify any columns to be included here. Selecting the Inspect Source and Populate Source Mapping Table buttons will make these columns available for the join operation.
Select Subset of Source Data
Any valid Python expression is acceptable to subset the data. Please see Expressions for more details and examples.
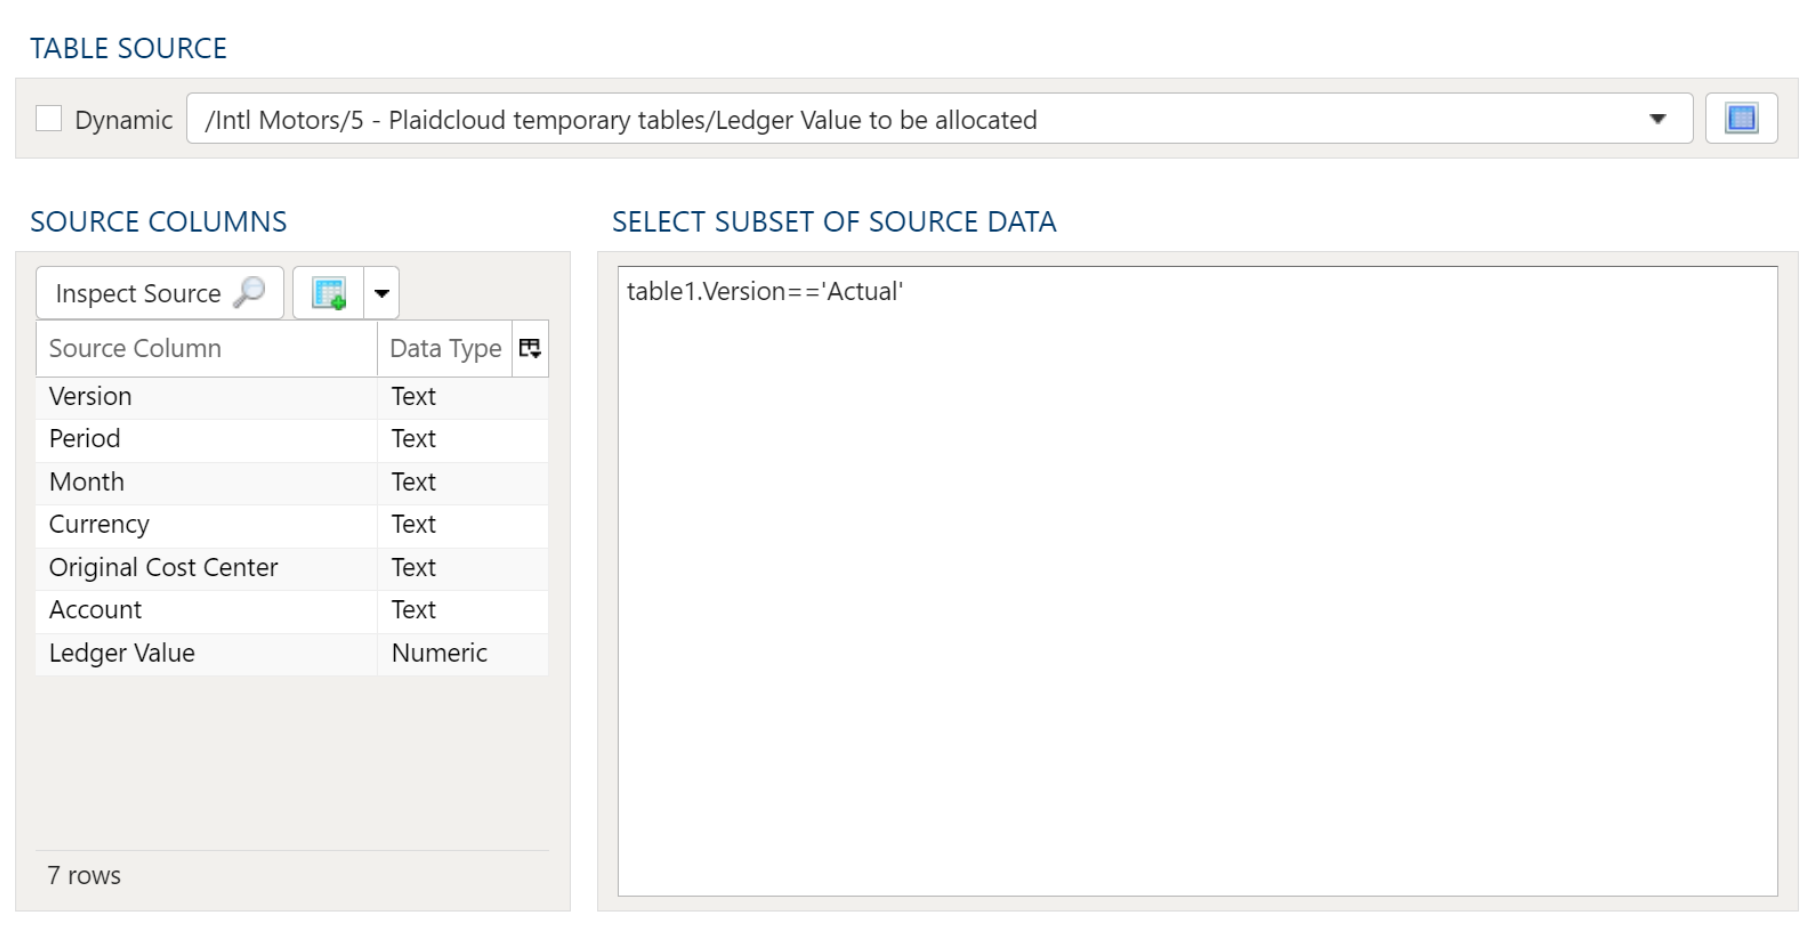
Table Output
Target Table

To establish the target table select either an existing table as the target table using the Target Table dropdown or click on the green "+" sign to create a new table as the target.
Table Creation
When creating a new table you will have the option to either create it as a View or as a Table.
Views:
Views are useful in that the time required for a step to execute is significantly less than when a table is used. The downside of views is they are not a useful for data exploration in the table Details mode.
Tables:
When using a table as the target a step will take longer to execute but data exploration in the Details mode is much quicker than with a view.
Join Map
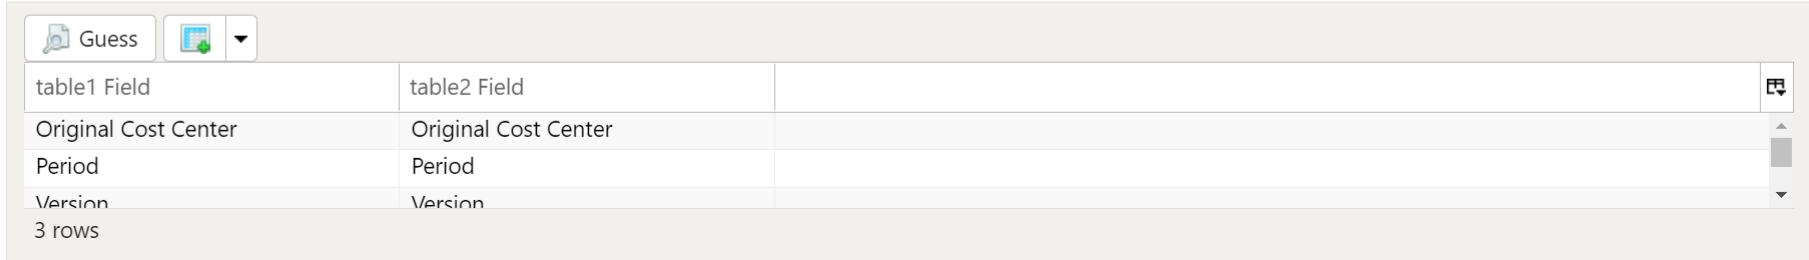
Specify join conditions. Using the Guess button will find all matching columns from both Table 1 as well as Table 2. To add additional columns manually, right click anywhere in the section and select either Insert Row or Append Row, to add a row prior to the currently selected row or to add a row at the end, respectively. Then, type the column names to match from Table 1 to Table 2. To remove a field from the Join Map, simply right-click and select Delete.
Target Output Columns
Data Mapper Configuration
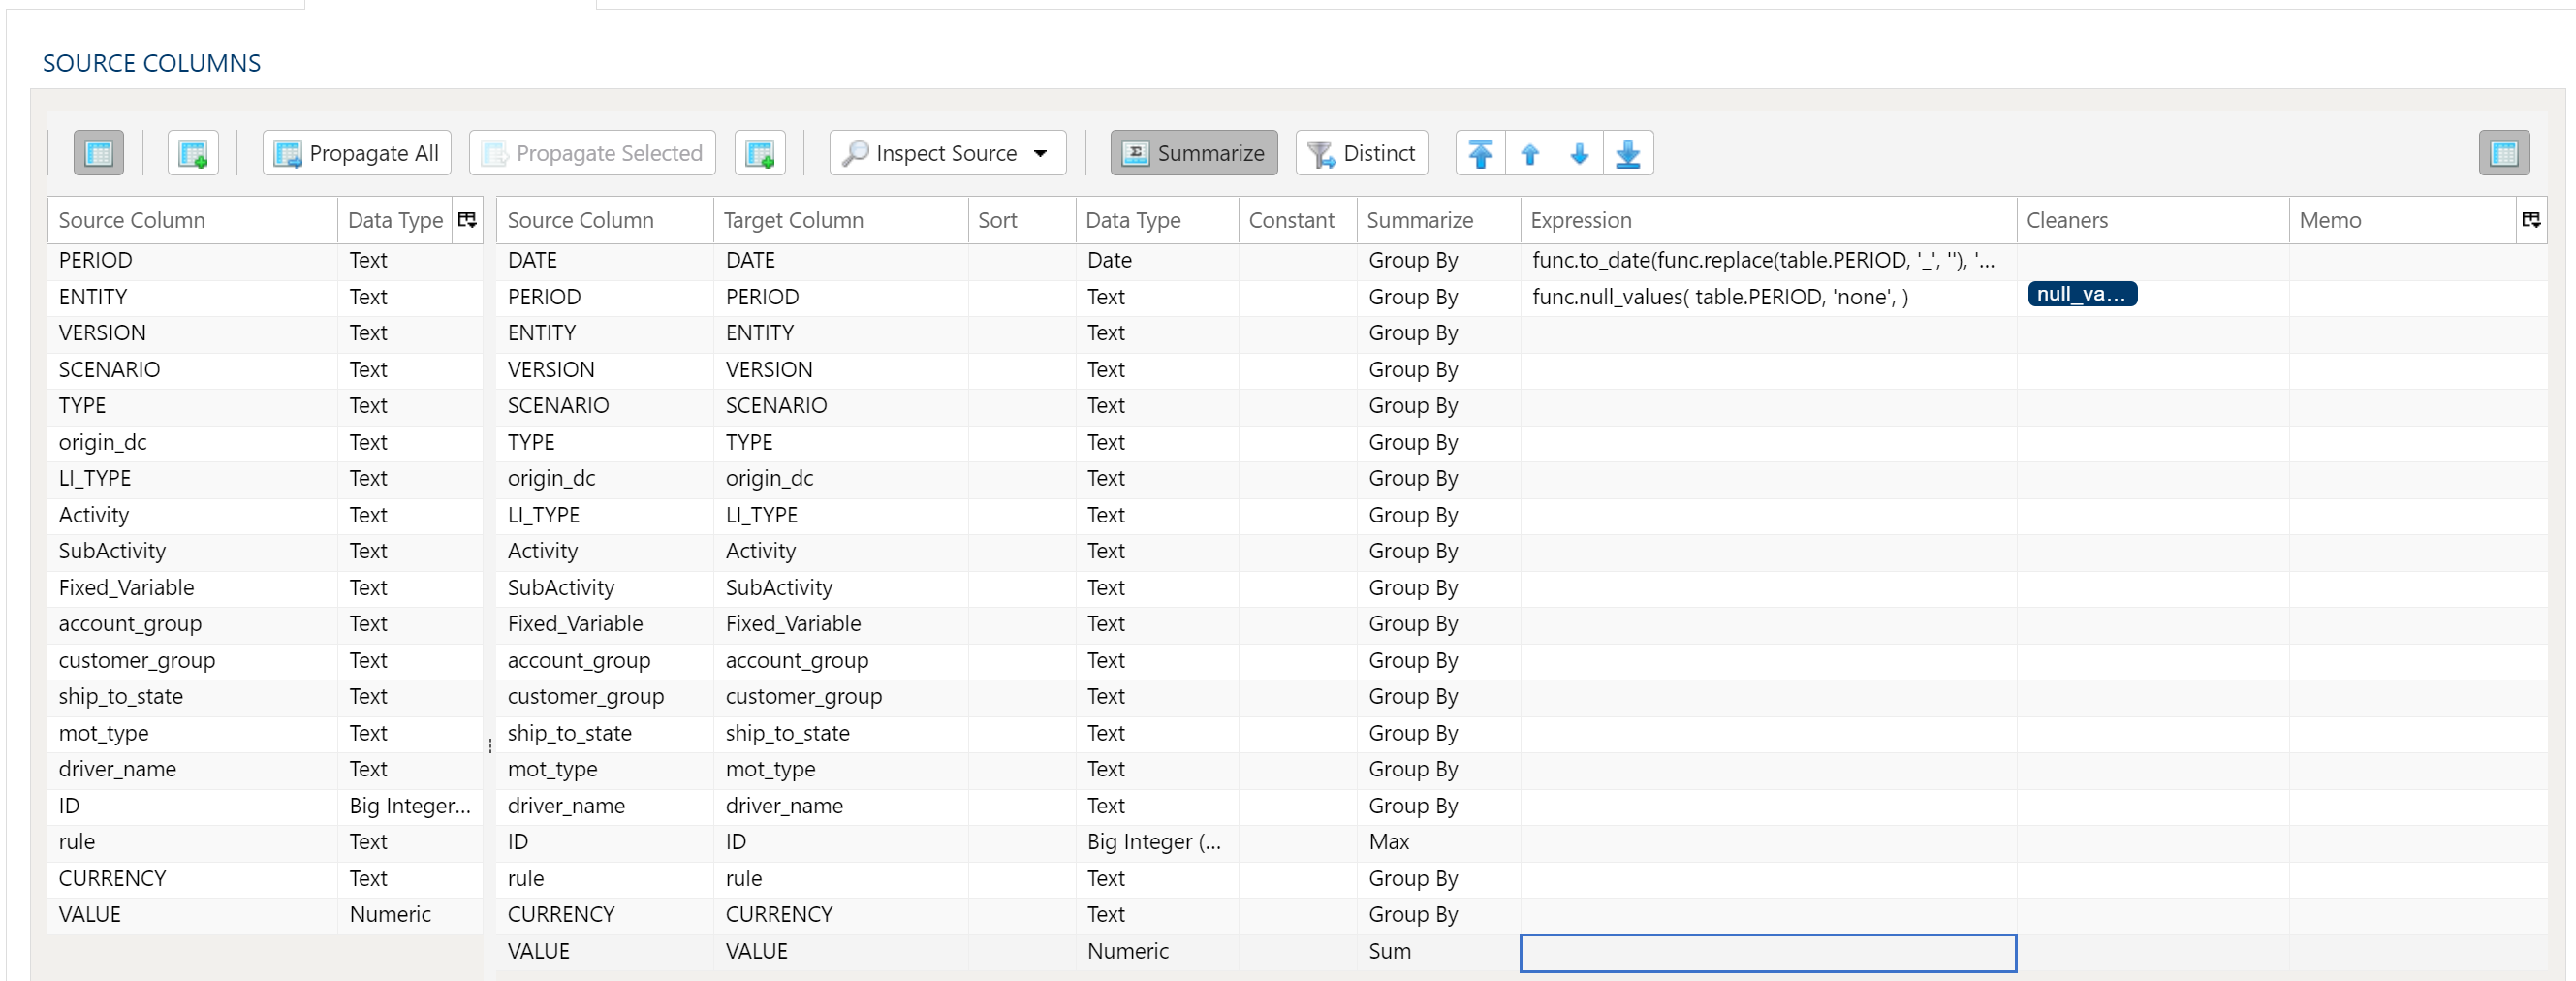
The Data Mapper is used to map columns from the source data to the target data table.
Inspection and Populating the Mapper
Using the Inspect Source menu button provides additional ways to map columns from source to target:
- Populate Both Mapping Tables: Propagates all values from the source data table into the target data table. This is done by default.
- Populate Source Mapping Table Only: Maps all values in the source data table only. This is helpful when modifying an existing workflow when source column structure has changed.
- Populate Target Mapping Table Only: Propagates all values into the target data table only.
If the source and target column options aren’t enough, other columns can be added into the target data table in several different ways:
- Propagate All will insert all source columns into the target data table, whether they already existed or not.
- Propagate Selected will insert selected source column(s) only.
- Right click on target side and select Insert Row to insert a row immediately above the currently selected row.
- Right click on target side and select Append Row to insert a row at the bottom (far right) of the target data table.
Deleting Columns
To delete columns from the target data table, select the desired column(s), then right click and select Delete.
Changing Column Order
To rearrange columns in the target data table, select the desired column(s). You can use either:
- Bulk Move Arrows: Select the desired move option from the arrows in the upper right
- Context Menu: Right clikc and select Move to Top, Move Up, Move Down, or Move to Bottom.
Reduce Result to Distinct Records Only
To return only distinct options, select the Distinct menu option. This will toggle a set of checkboxes for each column in the source. Simply check any box next to the corresponding column to return only distinct results.
Depending on the situation, you may want to consider use of Summarization instead.
The distinct process retains the first unique record found and discards the rest. You may want to apply a sort on the data if it is important for consistency between runs.
Aggregation and Grouping
To aggregate results, select the Summarize menu option. This will toggle a set of select boxes for each column in the target data table. Choose an appropriate summarization method for each column.
- Group By
- Sum
- Min
- Max
- First
- Last
- Count
- Count (including nulls)
- Mean
- Standard Deviation
- Sample Standard Deviation
- Population Standard Deviation
- Variance
- Sample Variance
- Population Variance
- Advanced Non-Group_By
For advanced data mapper usage such as expressions, cleaning, and constants, please see the Advanced Data Mapper Usage
Output Filters
To allow for maximum flexibility, data filters are available on the source data and the target data. For larger data sets, it can be especially beneficial to filter out rows on the source so the remaining operations are performed on a smaller data set.
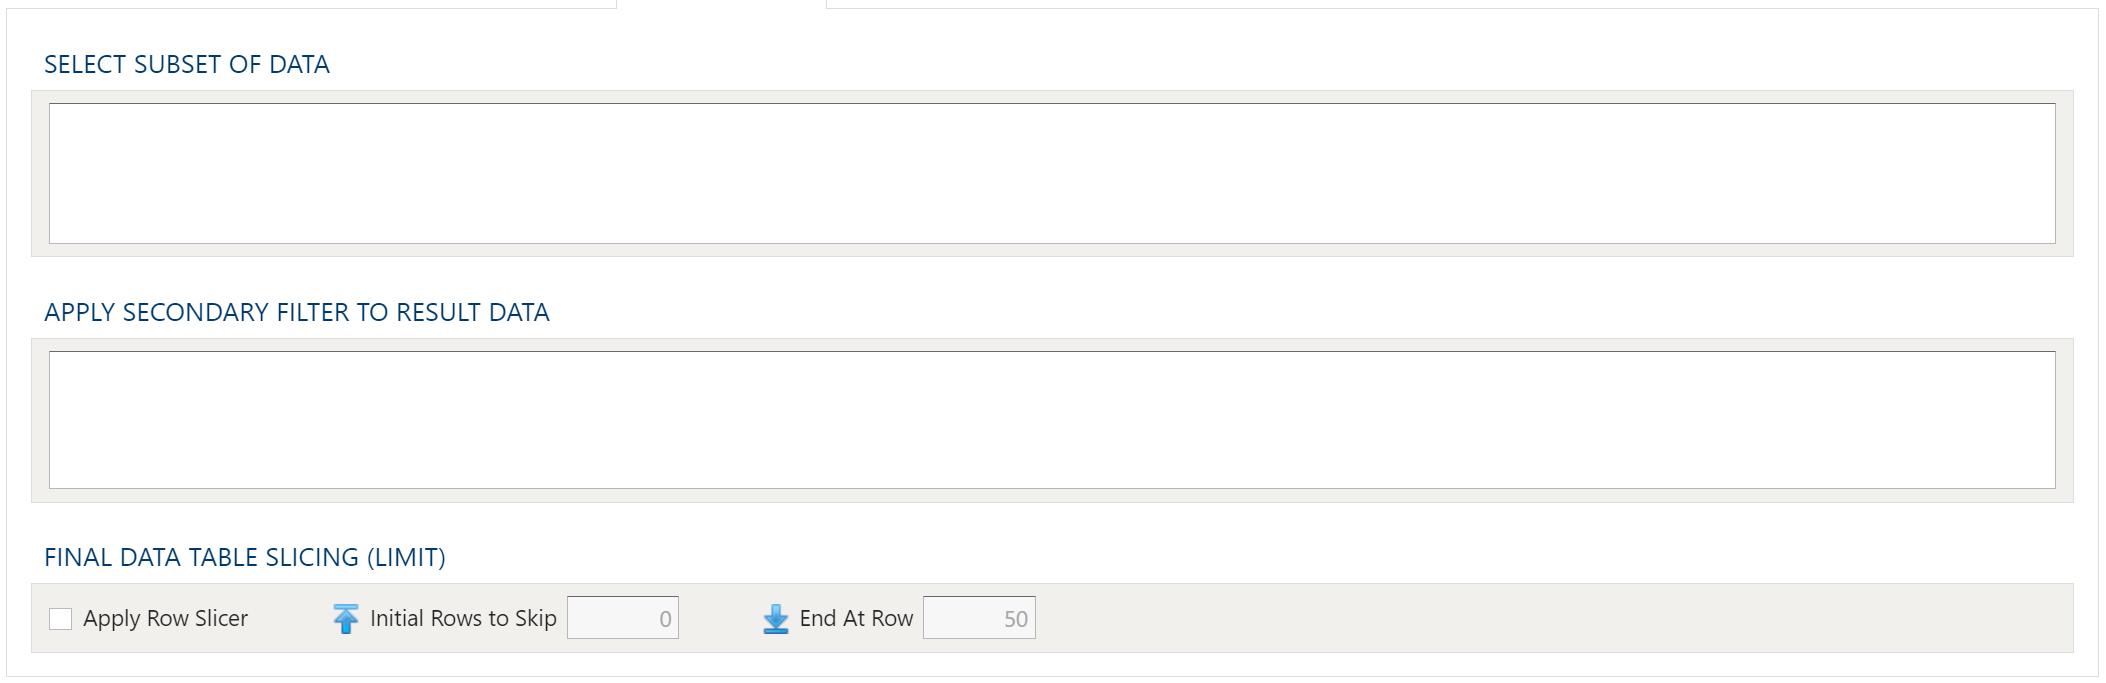
Select Subset Of Data
This filter type provides a way to filter the inbound source data based on the specified conditions.
Apply Secondary Filter To Result Data
This filter type provides a way to apply a filter to the post-transformed result data based on the specified conditions. The ability to apply a filter on the post-transformed result allows for exclusions based on results of complex calcuations, summarizaitons, or window functions.
Final Data Table Slicing (Limit)
The row slicing capability provides the ability to limit the rows in the result set based on a range and starting point.
Filter Syntax
The filter syntax utilizes Python SQLAlchemy which is the same syntax as other expressions.
View examples and expression functions in the Expressions area.
2 - Table Append
Description
Used append data to an existing table.
Load Parameters
Source and Target
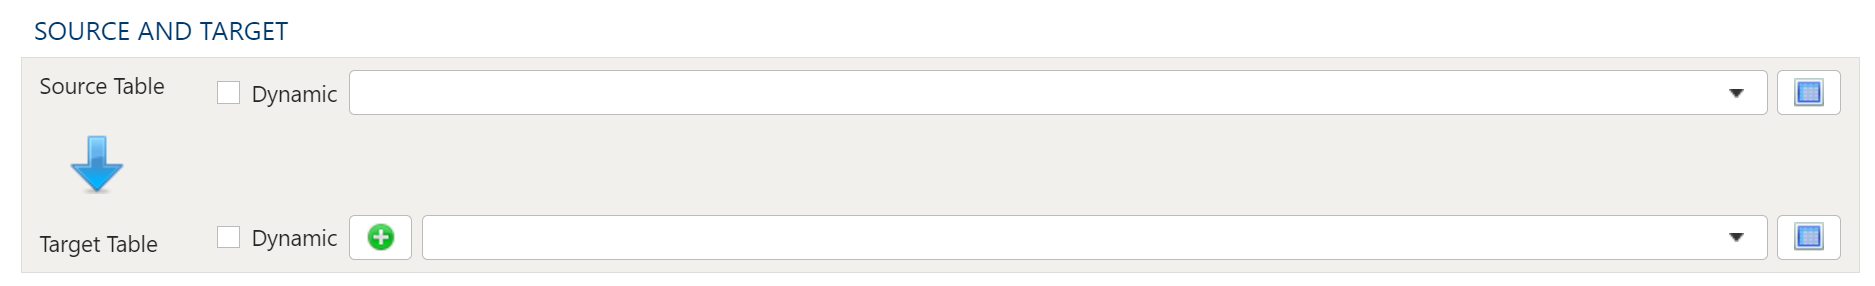
To establish the source and target tables, first select the data table to be extracted from using the Source Table dropdown menu. Next, select an existing table as the target table using the Target Table dropdown.
Table Data Selection
When configuring the Data Mapper the columns in the source table must be mapped to a column in the target table.
Data Mapper Configuration
The Data Mapper is used to map columns from the source data to the target data table.
Inspection and Populating the Mapper
Using the Inspect Source menu button provides additional ways to map columns from source to target:
- Populate Both Mapping Tables: Propagates all values from the source data table into the target data table. This is done by default.
- Populate Source Mapping Table Only: Maps all values in the source data table only. This is helpful when modifying an existing workflow when source column structure has changed.
- Populate Target Mapping Table Only: Propagates all values into the target data table only.
If the source and target column options aren’t enough, other columns can be added into the target data table in several different ways:
- Propagate All will insert all source columns into the target data table, whether they already existed or not.
- Propagate Selected will insert selected source column(s) only.
- Right click on target side and select Insert Row to insert a row immediately above the currently selected row.
- Right click on target side and select Append Row to insert a row at the bottom (far right) of the target data table.
Deleting Columns
To delete columns from the target data table, select the desired column(s), then right click and select Delete.
Changing Column Order
To rearrange columns in the target data table, select the desired column(s). You can use either:
- Bulk Move Arrows: Select the desired move option from the arrows in the upper right
- Context Menu: Right clikc and select Move to Top, Move Up, Move Down, or Move to Bottom.
Reduce Result to Distinct Records Only
To return only distinct options, select the Distinct menu option. This will toggle a set of checkboxes for each column in the source. Simply check any box next to the corresponding column to return only distinct results.
Depending on the situation, you may want to consider use of Summarization instead.
The distinct process retains the first unique record found and discards the rest. You may want to apply a sort on the data if it is important for consistency between runs.
Aggregation and Grouping
To aggregate results, select the Summarize menu option. This will toggle a set of select boxes for each column in the target data table. Choose an appropriate summarization method for each column.
- Group By
- Sum
- Min
- Max
- First
- Last
- Count
- Count (including nulls)
- Mean
- Standard Deviation
- Sample Standard Deviation
- Population Standard Deviation
- Variance
- Sample Variance
- Population Variance
- Advanced Non-Group_By
For advanced data mapper usage such as expressions, cleaning, and constants, please see the Advanced Data Mapper Usage
Data Filters
To allow for maximum flexibility, data filters are available on the source data and the target data. For larger data sets, it can be especially beneficial to filter out rows on the source so the remaining operations are performed on a smaller data set.
Select Subset Of Data
This filter type provides a way to filter the inbound source data based on the specified conditions.
Apply Secondary Filter To Result Data
This filter type provides a way to apply a filter to the post-transformed result data based on the specified conditions. The ability to apply a filter on the post-transformed result allows for exclusions based on results of complex calcuations, summarizaitons, or window functions.
Final Data Table Slicing (Limit)
The row slicing capability provides the ability to limit the rows in the result set based on a range and starting point.
Filter Syntax
The filter syntax utilizes Python SQLAlchemy which is the same syntax as other expressions.
View examples and expression functions in the Expressions area.
Examples
3 - Table Clear
Description
Clear the contents of an existing data table without deleting the actual data table. The end result is a data table with 0 rows.
Table Selection
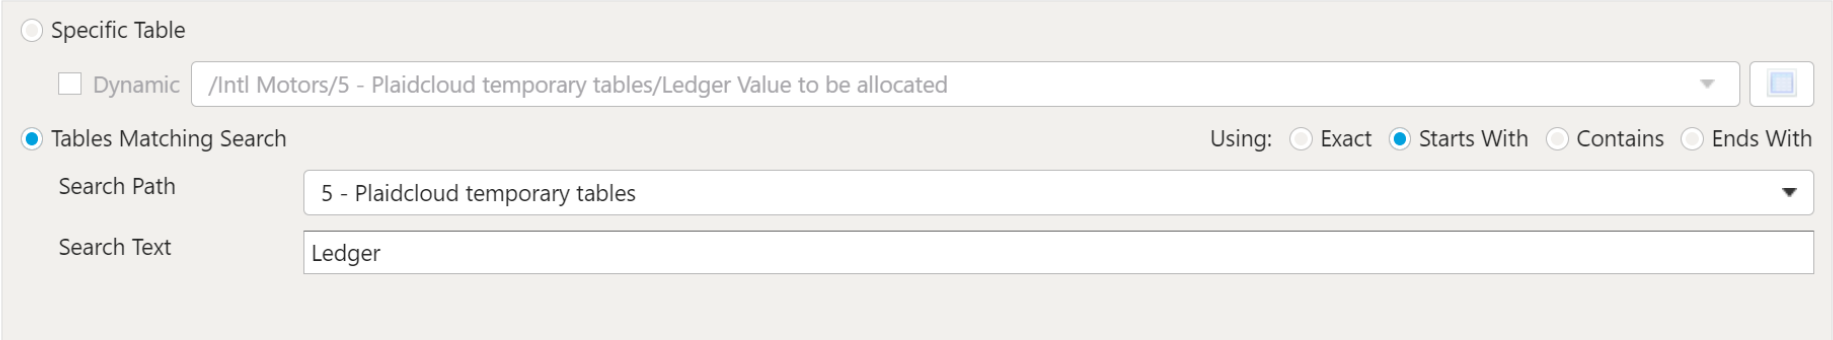
There are two options for selecting the table or in the second option tables to:
The first option is to use the Specific Table dropdown to select the table.
The second is to use the Tables Matching Search option in which you specify the Search Path and Search Text to select the table or tables that match the search criteria. This option is very useful if you have a workflow that creates a series of commonly named tables that that have been saved appending the date.
4 - Table Copy
Description
Create a copy of a data table.
Source and Target
To establish the source and target tables, first select the data table to be extracted from using the Source Table dropdown menu. Next, select either an existing table as the target table using the Target Table dropdown or click on the green "+" sign to create a new table as the target.
Table Creation
When creating a new table you will have the option to either create it as a View or as a Table.
Views:
Views are useful in that the time required for a step to execute is significantly less than when a table is used. The downside of views is they are not a useful for data exploration in the table Details mode.
Tables:
When using a table as the target a step will take longer to execute but data exploration in the Details mode is much quicker than with a view.
When performing the copy, Analyze will first check to see if the target data table already exists. If it does, no action will be performed unless the Allow Overwriting Existing Table checkbox is selected. If this is the case, the target table will be overwritten.
Examples
5 - Table Cross Join
Description
Use, as you might have expected, to perform a cross join operation on 2 data tables, combining them into a single data table without join key(s).
For more details on cross join methodology, see here: Wikipedia SQL Cross Join
Table Data Selection
Table Source
Specify the source data table by selecting it from the dropdown menu.
Source Columns
Specify any columns to be included here. Selecting the Inspect Source and Populate Source Mapping Table buttons will make these columns available for the join operation.
Select Subset of Source Data
Any valid Python expression is acceptable to subset the data. Please see Expressions for more details and examples.
Table Output
Target Table
To establish the target table select either an existing table as the target table using the Target Table dropdown or click on the green "+" sign to create a new table as the target.
Table Creation
When creating a new table you will have the option to either create it as a View or as a Table.
Views:
Views are useful in that the time required for a step to execute is significantly less than when a table is used. The downside of views is they are not a useful for data exploration in the table Details mode.
Tables:
When using a table as the target a step will take longer to execute but data exploration in the Details mode is much quicker than with a view.
Target Output Columns
Data Mapper Configuration
The Data Mapper is used to map columns from the source data to the target data table.
Inspection and Populating the Mapper
Using the Inspect Source menu button provides additional ways to map columns from source to target:
- Populate Both Mapping Tables: Propagates all values from the source data table into the target data table. This is done by default.
- Populate Source Mapping Table Only: Maps all values in the source data table only. This is helpful when modifying an existing workflow when source column structure has changed.
- Populate Target Mapping Table Only: Propagates all values into the target data table only.
If the source and target column options aren’t enough, other columns can be added into the target data table in several different ways:
- Propagate All will insert all source columns into the target data table, whether they already existed or not.
- Propagate Selected will insert selected source column(s) only.
- Right click on target side and select Insert Row to insert a row immediately above the currently selected row.
- Right click on target side and select Append Row to insert a row at the bottom (far right) of the target data table.
Deleting Columns
To delete columns from the target data table, select the desired column(s), then right click and select Delete.
Changing Column Order
To rearrange columns in the target data table, select the desired column(s). You can use either:
- Bulk Move Arrows: Select the desired move option from the arrows in the upper right
- Context Menu: Right clikc and select Move to Top, Move Up, Move Down, or Move to Bottom.
Reduce Result to Distinct Records Only
To return only distinct options, select the Distinct menu option. This will toggle a set of checkboxes for each column in the source. Simply check any box next to the corresponding column to return only distinct results.
Depending on the situation, you may want to consider use of Summarization instead.
The distinct process retains the first unique record found and discards the rest. You may want to apply a sort on the data if it is important for consistency between runs.
Aggregation and Grouping
To aggregate results, select the Summarize menu option. This will toggle a set of select boxes for each column in the target data table. Choose an appropriate summarization method for each column.
- Group By
- Sum
- Min
- Max
- First
- Last
- Count
- Count (including nulls)
- Mean
- Standard Deviation
- Sample Standard Deviation
- Population Standard Deviation
- Variance
- Sample Variance
- Population Variance
- Advanced Non-Group_By
For advanced data mapper usage such as expressions, cleaning, and constants, please see the Advanced Data Mapper Usage
Output Filters
To allow for maximum flexibility, data filters are available on the source data and the target data. For larger data sets, it can be especially beneficial to filter out rows on the source so the remaining operations are performed on a smaller data set.
Select Subset Of Data
This filter type provides a way to filter the inbound source data based on the specified conditions.
Apply Secondary Filter To Result Data
This filter type provides a way to apply a filter to the post-transformed result data based on the specified conditions. The ability to apply a filter on the post-transformed result allows for exclusions based on results of complex calcuations, summarizaitons, or window functions.
Final Data Table Slicing (Limit)
The row slicing capability provides the ability to limit the rows in the result set based on a range and starting point.
Filter Syntax
The filter syntax utilizes Python SQLAlchemy which is the same syntax as other expressions.
View examples and expression functions in the Expressions area.
6 - Table Drop
Description
Drop/delete a data table.
Table Selection
Table Selection
There are two options for selecting the table or in the second option tables to:
The first option is to use the Specific Table dropdown to select the table.
The second is to use the Tables Matching Search option in which you specify the Search Path and Search Text to select the table or tables that match the search criteria. This option is very useful if you have a workflow that creates a series of commonly named tables that that have been saved appending the date.
7 - Table Extract
Description
Used to extract data from an existing Analyze data table into another data table. Examples include, but are not limited to, the following:
- Sort
- Group
- Summarization
- Filter/Subset Rows
- Drop Extra Columns
- Math Operations
- String Operations
Extract Parameters
Source and Target
To establish the source and target tables, first select the data table to be extracted from using the Source Table dropdown menu. Next, select either an existing table as the target table using the Target Table dropdown or click on the green "+" sign to create a new table as the target.
Table Creation
When creating a new table you will have the option to either create it as a View or as a Table.
Views:
Views are useful in that the time required for a step to execute is significantly less than when a table is used. The downside of views is they are not a useful for data exploration in the table Details mode.
Tables:
When using a table as the target a step will take longer to execute but data exploration in the Details mode is much quicker than with a view.
Table Data Selection
Data Mapper Configuration
The Data Mapper is used to map columns from the source data to the target data table.
Inspection and Populating the Mapper
Using the Inspect Source menu button provides additional ways to map columns from source to target:
- Populate Both Mapping Tables: Propagates all values from the source data table into the target data table. This is done by default.
- Populate Source Mapping Table Only: Maps all values in the source data table only. This is helpful when modifying an existing workflow when source column structure has changed.
- Populate Target Mapping Table Only: Propagates all values into the target data table only.
If the source and target column options aren’t enough, other columns can be added into the target data table in several different ways:
- Propagate All will insert all source columns into the target data table, whether they already existed or not.
- Propagate Selected will insert selected source column(s) only.
- Right click on target side and select Insert Row to insert a row immediately above the currently selected row.
- Right click on target side and select Append Row to insert a row at the bottom (far right) of the target data table.
Deleting Columns
To delete columns from the target data table, select the desired column(s), then right click and select Delete.
Changing Column Order
To rearrange columns in the target data table, select the desired column(s). You can use either:
- Bulk Move Arrows: Select the desired move option from the arrows in the upper right
- Context Menu: Right clikc and select Move to Top, Move Up, Move Down, or Move to Bottom.
Reduce Result to Distinct Records Only
To return only distinct options, select the Distinct menu option. This will toggle a set of checkboxes for each column in the source. Simply check any box next to the corresponding column to return only distinct results.
Depending on the situation, you may want to consider use of Summarization instead.
The distinct process retains the first unique record found and discards the rest. You may want to apply a sort on the data if it is important for consistency between runs.
Aggregation and Grouping
To aggregate results, select the Summarize menu option. This will toggle a set of select boxes for each column in the target data table. Choose an appropriate summarization method for each column.
- Group By
- Sum
- Min
- Max
- First
- Last
- Count
- Count (including nulls)
- Mean
- Standard Deviation
- Sample Standard Deviation
- Population Standard Deviation
- Variance
- Sample Variance
- Population Variance
- Advanced Non-Group_By
For advanced data mapper usage such as expressions, cleaning, and constants, please see the Advanced Data Mapper Usage
Data Filters
To allow for maximum flexibility, data filters are available on the source data and the target data. For larger data sets, it can be especially beneficial to filter out rows on the source so the remaining operations are performed on a smaller data set.
Select Subset Of Data
This filter type provides a way to filter the inbound source data based on the specified conditions.
Apply Secondary Filter To Result Data
This filter type provides a way to apply a filter to the post-transformed result data based on the specified conditions. The ability to apply a filter on the post-transformed result allows for exclusions based on results of complex calcuations, summarizaitons, or window functions.
Final Data Table Slicing (Limit)
The row slicing capability provides the ability to limit the rows in the result set based on a range and starting point.
Filter Syntax
The filter syntax utilizes Python SQLAlchemy which is the same syntax as other expressions.
View examples and expression functions in the Expressions area.
Examples
8 - Table Faker
Description
Table Faker generates fake data.
Address
| Generator | Optional Arguments | | Building Number | | | City | | | City Suffix | | | Country | | | Country Code | “representation”=”alpha-2” | | Full Address | | | Latitude | | | Longitude | | | Military DPO | | | Postal Code | | | Postal Code Plus 4 | | | State | | | State Abbreviation | | | Street Address | | | Street Name | | | Street Suffix | |
Automotive
| Generator | Optional Arguments | | License Plate | |
Barcode
| Generator | Optional Arguments | | EAN13 | | | EAN8 | |
Colors
| Generator | Optional Arguments | | Color Name | | | Hex Color | | | RGB Color | | | RGB CSS Color | | | Safe Color Name | | | Safe Hex Color | |
Company
| Generator | Optional Arguments | | Company Catch Phrase | | | Company Name | | | Company Suffix | |
Credit Card
| Generator | Optional Arguments | | Expriration Date | “start”=”now”“end”=”+10y”## ‘12/20’ | | Full | “card_type”=null | | Number | “card_type”=null | | Provider | “card_type”=null | | Security Code | “card_type”=null |
Currency
| Generator | Optional Arguments | | Code | |
Date Time
| Generator | Optional Arguments | | AM/PM | | | Century | | | Date | “pattern”:”%Y-%m-%d”“end_datetime”:null | | Date Time | “tzinfo”:null“end_datetime”=null | | Date Time this Century | “before_now”=true“after_now”=false“tzinfo”=null | | Date Time this Decade | “before_now”=true“after_now”=false“tzinfo”=null | | Date Time this Month | “before_now”=true“after_now”=false“tzinfo”=null | | Date Time this Year | “before_now”=true“after_now”=false“tzinfo”=null | | Day of Month | | | Day of Week | | | ISO8601 Date Time | “tzinfo”=null“end_datetime”=null | | Month | | | Month Name | | | Past Date (Last 30 Days) | “start_date”=”-30d”“tzinfo”=null | | Timezone | | | Unix Time | “end_datetime”=null“start_datetime”=null | | Year | |
File
| Generator | Optional Arguments | | File Extension | “category”=null | | File Name | “category”=null“extension”=null | | File Path | “depth”=”1”“category”=null“extension”=null | | Mime Type | “category”=null |
Internet
| Generator | Optional Arguments | | Company Email | | | Domain Name | | | Domain Word | | | Email | | | Free Email | | | Free Email Domain | | | Image URL | “width”=null“height”=null | | IPv4 | “network”=false“address_class”=”no”“private”=null | | IPv6 | “network”=false | | MAC Address | | | Safe Email | | | Slug | | | TLD | | | URI | | | URL | “schemes”=null | | URL Extension | | | URL Page | | | User Name | |
ISBN
| Generator | Optional Arguments | | ISBN10 | “eparator”=”-“ | | ISBN13 | “eparator”=”-“ |
Job
| Generator | Optional Arguments | | Job Name | |
Lorem
| Generator | Optional Arguments | | Paragraph | “nb_sentences”=”3”“variable_nb_sentences”=true“ext_word_list”=null | | Paragraphs | “nb”=”3”“ext_word_list”=null | | Sentence | “nb_words”=”6”“variable_nb_words”=true“ext_word_list”=null | | Sentences | “nb”=”3”“ext_word_list”=null | | Text | “max_nb_chars”=”200”“ext_word_list”=null | | Word | “ext_word_list”=null | | Words | “nb”=”3”“ext_word_list”=null |
Misc
| Generator | Optional Arguments | | Binary | “length”=”1048576” | | Boolean | “chance_of_getting_true”=”50” | | Null Boolean | | | Locale | | | Language Code | | | MD5 | “raw_output”=false | | Password | “length”=”10”“special_chars”=true“digits”=true“upper_case”=true“lower_case”=true | | Random String | | | SHA1 | “raw_output”=false | | SHA256 | “raw_output”=false | | UUID4 | |
Numeric
| Generator | Optional Arguments | | Big Serial (Auto Increment) | | | Random Float | | | Random Float in Range | | | Random Integer | | | Random Integer in Range | | | Random Numeric | | | Random Percentage (0 – 1) | | | Random Percentage (0 – 100) | | | Serial (Auto Increment) | |
Person
| Generator | Optional Arguments | | First Name | | | First Name Female | | | First Name Male | | | Full Name | | | Full Name Female | | | Full Name Male | | | Last Name | | | Last Name Female | | | Last Name Male | | | Prefix | | | Prefix Female | | | Prefix Male | | | Suffix | | | Suffix Female | | | Suffix Male | |
Phone
| Generator | Optional Arguments | | Phone Number | | | ISDN | |
Tax
| Generator | Optional Arguments | | EIN | | | Full SSN | | | ITIN | |
User Agent
| Generator | Optional Arguments | | Chrome | “version_from”=”13”“version_to”=”63”“build_from”=”800”“build_to”=”899” | | Firefox | | | Full User Agent | | | Internet Explorer | | | Linux Platform Token | | | Linux Processor | | | Mac Platform Token | | | Mac Processor | | | Opera | | | Safari | | | Windows Platform Token | |
Special Generators
While these two generators do not have arguments, the options they provide act similarly to arguments.
Pattern Generator:
| Number | Format | Output | Description | | 3.1415926 | {:.2f} | 3.14 | 2 decimal places | | 3.1415926 | {:+.2f} | +3.14 | 2 decimal places with sign | | -1 | {:+.2f} | -1.00 | 2 decimal places with sign | | 2.71828 | {:.0f} | 3 | No decimal places | | 5 | {:0>2d} | 05 | Pad number with zeros (left padding, width 2) | | 5 | {:x<4d} | 5xxx | Pad Number with x’s (right padding, width 4) | | 10 | {:x<4d} | 10xx | Pad number with x’s (right padding, width 4) | | 1000000 | {:,} | 1,000,000 | Number format with comma separator | | 0.25 | {:.2%} | 25.00% | Format percentage | | 1000000000 | {:.2e} | 1.00e+09 | Exponent notation | | 13 | {:10d} | 13 | Right aligned (default, width 10) | | 13 | {:<10d} | 13 | Left aligned (width 10) | | 13 | {:^10d} | 13 | Center aligned (width 10) |
Random Choice:
In order to provide the options for random choice, simply put your options in quotes and seperate each option with a comma. So a string of random choice options would appear like this: “x”,”y”,”z”
Here, the “Key Word Args/Pattern/Choices” column of the “pattern” row contains a sentence with several references. The first reference equation ( {percentage0-100:.2f}% ) points to the “percentage0-100” row which will generate a random equation. Therefore, the random percentage produced by the “percentage0-100” row will be automatically inserted into the sentence. The reference equation {first_name} points to the row titled “first_name” which will randomly generate a first name, and this name will be automatically inserted into the sentence. The last reference equation ( {randomn_choice} ) operates the same as the other two.
With this, when the pattern generator is run, you will recieve the following results.
9 - Table In-Place Delete
Description
Performs a delete on the table using the specified filter conditions. The operation is performed on the designated table directly so no additional tables are created. Only the rows that meet the filter criteria are deleted. This may be an effective approach when encountering concerns related to data size.
Delete Parameters
Select the Source table for deleting from the dropdown list. This list includes all Project and Workflow data tables.
Data Filters for Delete
Examples
10 - Table In-Place Update
Description
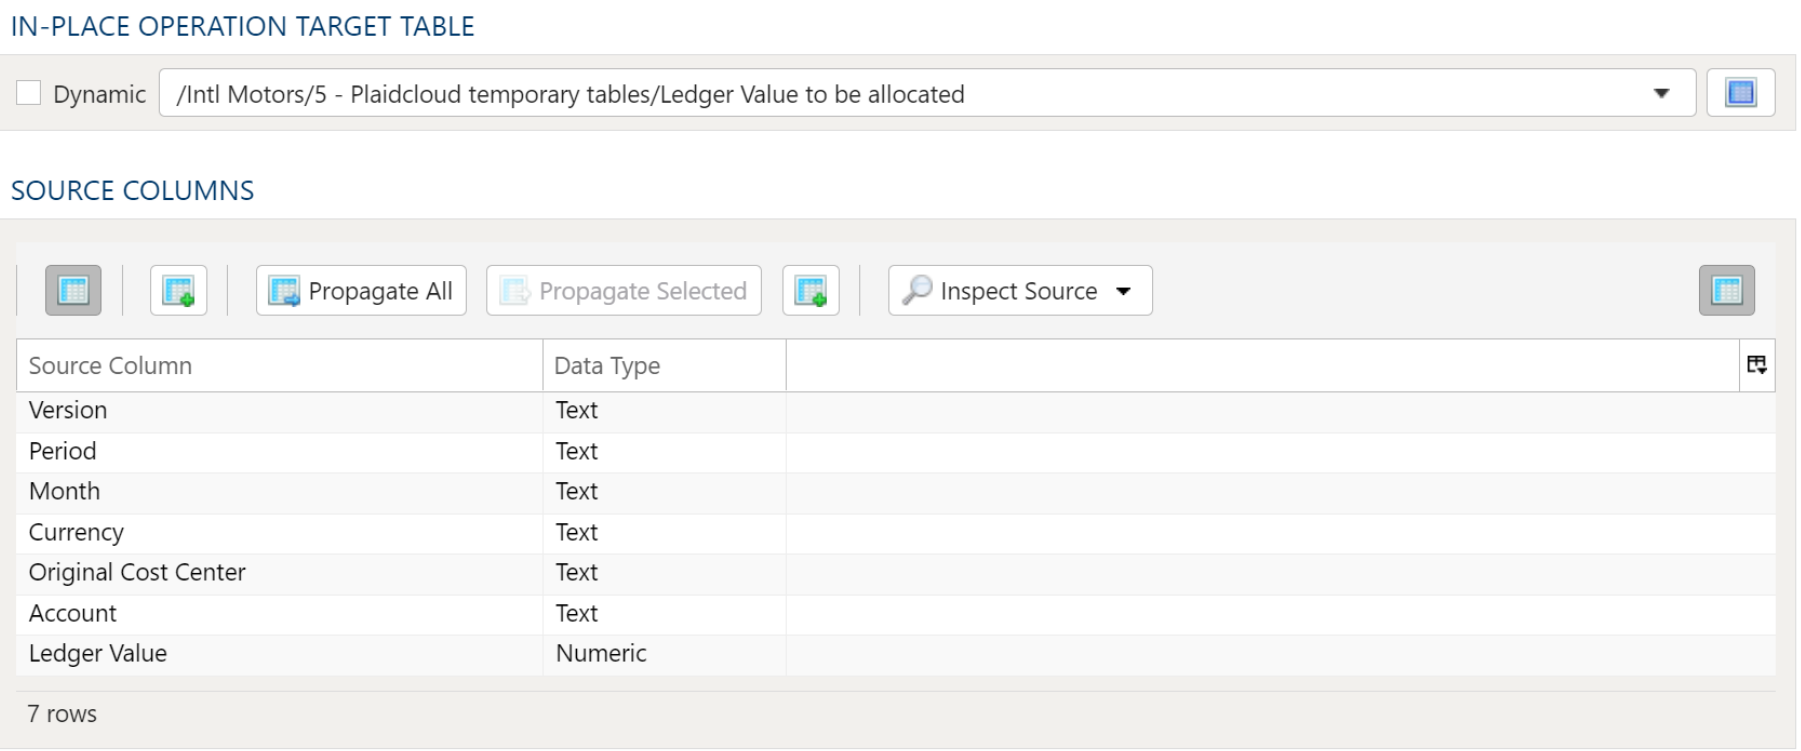
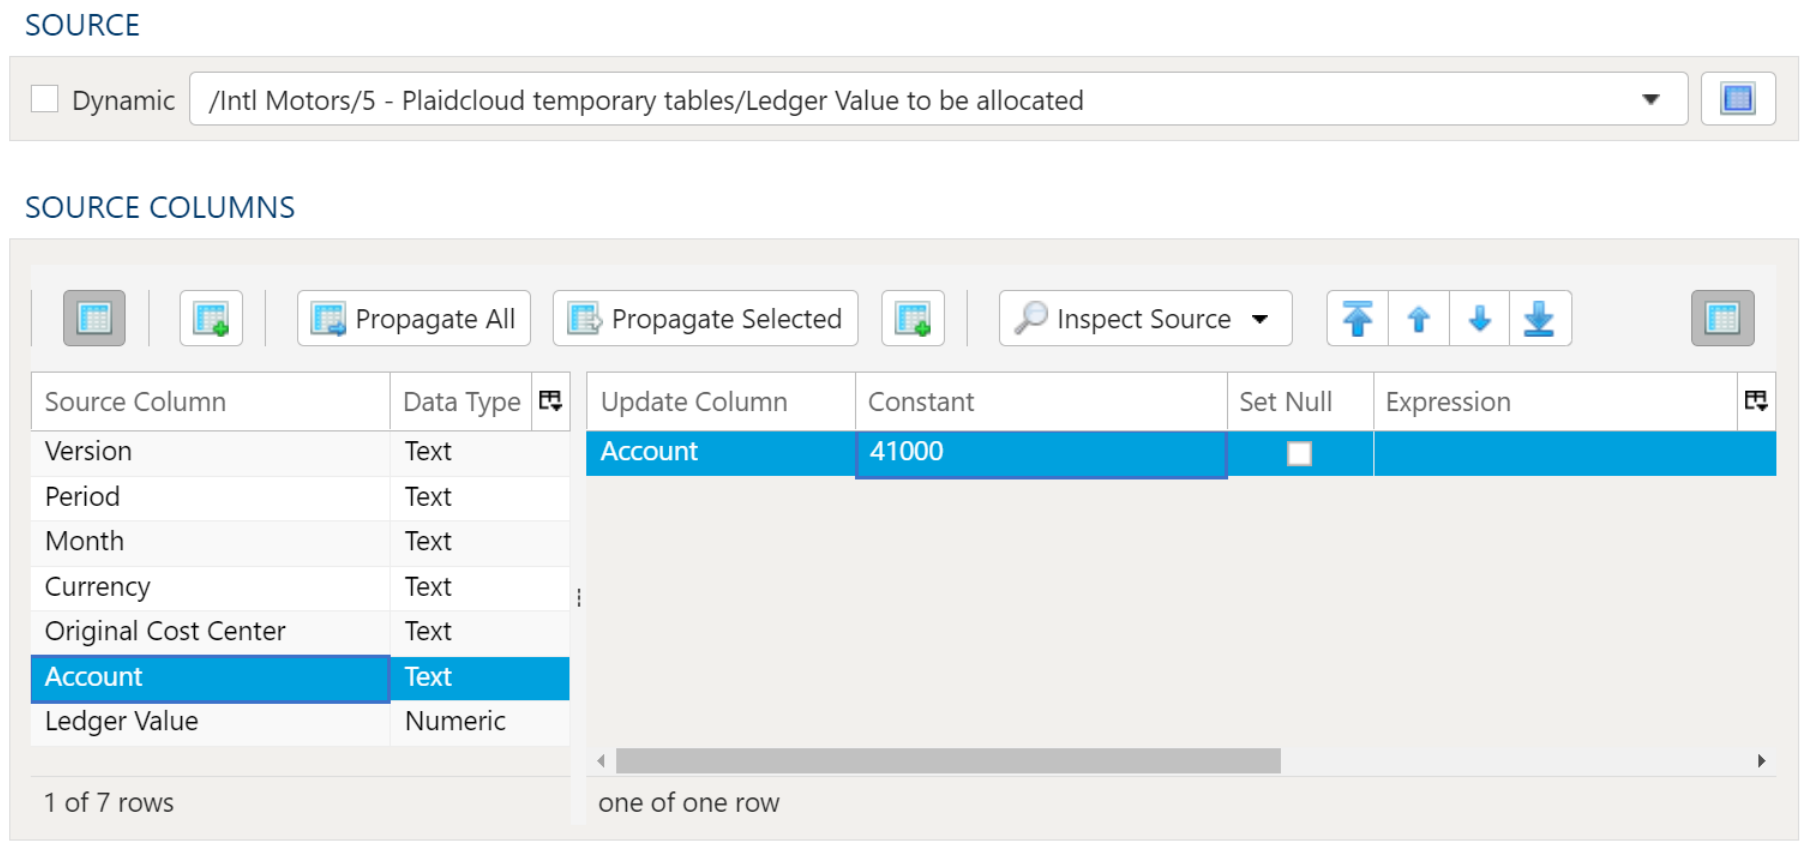
Performs an update on the table using the specified filter conditions and value settings. The operation is performed directly on the designated table, so no additional tables are created. This may be an effective approach when concerns of data size are encountered.
Table Selection
Select the Source table for updating from the dropdown list. This list includes all Project and Workflow data tables.
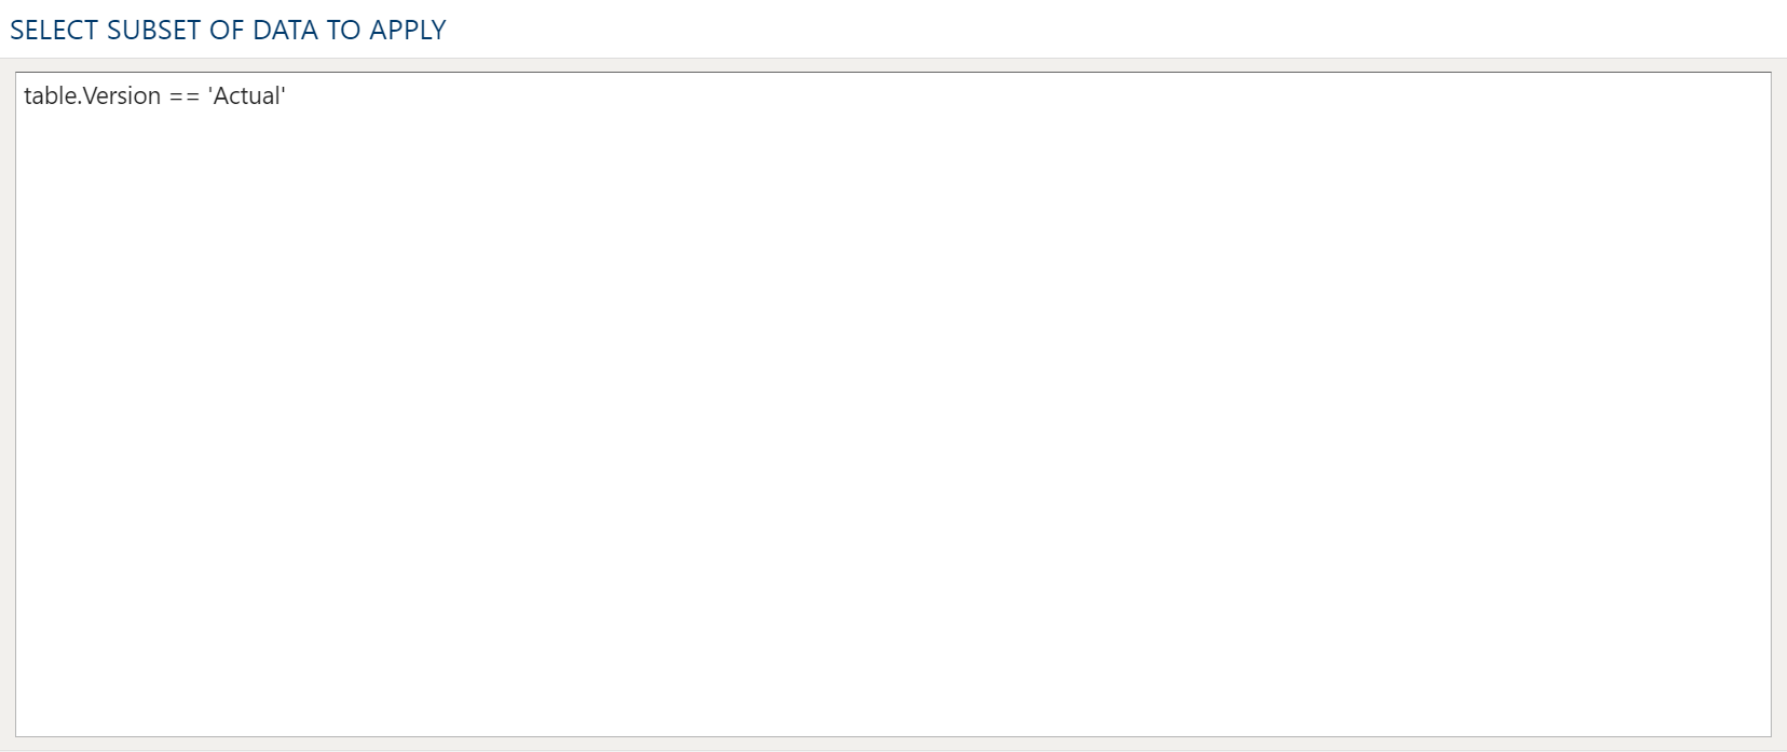
Examples
In this example the Account will be set to 41000 when the Version is equal to "Actual" in "Ledger Value to be allocated".
11 - Table Inner Join
Description
Use, as you might have expected, to perform an inner join operation on 2 data tables, combining them into a single data table based upon the specified join key(s).
For more details on inner join methodology, see here: Wikipedia SQL Inner Join
Table Data Selection
Table Source
Specify the source data table by selecting it from the dropdown menu.
Source Columns
Specify any columns to be included here. Selecting the Inspect Source and Populate Source Mapping Table buttons will make these columns available for the join operation.
Select Subset of Source Data
Any valid Python expression is acceptable to subset the data. Please see Expressions for more details and examples.
Table Output
Target Table
To establish the target table select either an existing table as the target table using the Target Table dropdown or click on the green "+" sign to create a new table as the target.
Table Creation
When creating a new table you will have the option to either create it as a View or as a Table.
Views:
Views are useful in that the time required for a step to execute is significantly less than when a table is used. The downside of views is they are not a useful for data exploration in the table Details mode.
Tables:
When using a table as the target a step will take longer to execute but data exploration in the Details mode is much quicker than with a view.
Join Map
Specify join conditions. Using the Guess button will find all matching columns from both Table 1 as well as Table 2. To add additional columns manually, right click anywhere in the section and select either Insert Row or Append Row, to add a row prior to the currently selected row or to add a row at the end, respectively. Then, type the column names to match from Table 1 to Table 2. To remove a field from the Join Map, simply right-click and select Delete.
Target Output Columns
Data Mapper Configuration
The Data Mapper is used to map columns from the source data to the target data table.
Inspection and Populating the Mapper
Using the Inspect Source menu button provides additional ways to map columns from source to target:
- Populate Both Mapping Tables: Propagates all values from the source data table into the target data table. This is done by default.
- Populate Source Mapping Table Only: Maps all values in the source data table only. This is helpful when modifying an existing workflow when source column structure has changed.
- Populate Target Mapping Table Only: Propagates all values into the target data table only.
If the source and target column options aren’t enough, other columns can be added into the target data table in several different ways:
- Propagate All will insert all source columns into the target data table, whether they already existed or not.
- Propagate Selected will insert selected source column(s) only.
- Right click on target side and select Insert Row to insert a row immediately above the currently selected row.
- Right click on target side and select Append Row to insert a row at the bottom (far right) of the target data table.
Deleting Columns
To delete columns from the target data table, select the desired column(s), then right click and select Delete.
Changing Column Order
To rearrange columns in the target data table, select the desired column(s). You can use either:
- Bulk Move Arrows: Select the desired move option from the arrows in the upper right
- Context Menu: Right clikc and select Move to Top, Move Up, Move Down, or Move to Bottom.
Reduce Result to Distinct Records Only
To return only distinct options, select the Distinct menu option. This will toggle a set of checkboxes for each column in the source. Simply check any box next to the corresponding column to return only distinct results.
Depending on the situation, you may want to consider use of Summarization instead.
The distinct process retains the first unique record found and discards the rest. You may want to apply a sort on the data if it is important for consistency between runs.
Aggregation and Grouping
To aggregate results, select the Summarize menu option. This will toggle a set of select boxes for each column in the target data table. Choose an appropriate summarization method for each column.
- Group By
- Sum
- Min
- Max
- First
- Last
- Count
- Count (including nulls)
- Mean
- Standard Deviation
- Sample Standard Deviation
- Population Standard Deviation
- Variance
- Sample Variance
- Population Variance
- Advanced Non-Group_By
For advanced data mapper usage such as expressions, cleaning, and constants, please see the Advanced Data Mapper Usage
Output Filters
To allow for maximum flexibility, data filters are available on the source data and the target data. For larger data sets, it can be especially beneficial to filter out rows on the source so the remaining operations are performed on a smaller data set.
Select Subset Of Data
This filter type provides a way to filter the inbound source data based on the specified conditions.
Apply Secondary Filter To Result Data
This filter type provides a way to apply a filter to the post-transformed result data based on the specified conditions. The ability to apply a filter on the post-transformed result allows for exclusions based on results of complex calcuations, summarizaitons, or window functions.
Final Data Table Slicing (Limit)
The row slicing capability provides the ability to limit the rows in the result set based on a range and starting point.
Filter Syntax
The filter syntax utilizes Python SQLAlchemy which is the same syntax as other expressions.
View examples and expression functions in the Expressions area.
Examples
Join Automobile Manufacturers with Models
In this example, consider the following source data tables. First is a list of automobile manufacturers.
| Mfg_ID | Manufacturer |
|---|---|
| 1 | Aston Martin |
| 2 | Porsche |
| 3 | Lamborghini |
| 4 | Ferrari |
| 5 | Koenigsegg |
Next is a list of automobile models with a manufacturer ID. Note that there are several models with no manufacturer.
| ModelName | Mfg_ID |
|---|---|
| Aventador | 3 |
| Countach | 3 |
| DBS | 1 |
| Enzo | 4 |
| One-77 | 1 |
| Optimus Prime | |
| Batmobile | |
| Agera | 5 |
| Lightning McQueen |
To get a list of models by manufacturer, it makes sense to join on Mfg_ID.
First, specify parameters for Table 1 Data Selection. The source data table is selected and all columns are listed.
Next, specify parameters for Table 2 Data Selection. Once again, the source data table is selected and all columns are listed.
Finally, the join conditions are set in the Table Output tab. Using the Guess button, Analyze properly identifies the Mfg_ID column to use as the Join Key. Lastly, the
Target Output Columns are specified automatically using the Propagate button. This effectively includes all columns from all tables, with all join columns included only a single time. Note that the columns are sorted alphabetically, first by Manufacturer and next by ModelName.
As expected, the final output only includes values which had a match in both tables. As such, Porsche does not show up because it had no models. Likewise, the
Batmobile had no manufacturer (it was a custom job), so it’s not included.
12 - Table Lookup
Description
If you are a regular user of the vlookup function in Microsoft Excel, the Table Lookup transform should feel very familiar. It’s used to perform essentially the same function. Unlike the Microsoft Excel version, the PlaidCloud Analyze Table Lookup transform offers greater flexibility, especially allowing for matching on and returning multiple columns.
Table Data Selection
Table Source
Specify the source data table by selecting it from the dropdown menu.
Source Columns
Specify any columns to be included here. Selecting the Inspect Source and Populate Source Mapping Table buttons will make these columns available for the join operation.
Select Subset of Source Data
Any valid Python expression is acceptable to subset the data. Please see Expressions for more details and examples.
Table Output
Target Table
To establish the target table select either an existing table as the target table using the Target Table dropdown or click on the green "+" sign to create a new table as the target.
Table Creation
When creating a new table you will have the option to either create it as a View or as a Table.
Views:
Views are useful in that the time required for a step to execute is significantly less than when a table is used. The downside of views is they are not a useful for data exploration in the table Details mode.
Tables:
When using a table as the target a step will take longer to execute but data exploration in the Details mode is much quicker than with a view.
Join Map
Specify join conditions. Using the Guess button will find all matching columns from both Table 1 as well as Table 2. To add additional columns manually, right click anywhere in the section and select either Insert Row or Append Row, to add a row prior to the currently selected row or to add a row at the end, respectively. Then, type the column names to match from Table 1 to Table 2. To remove a field from the Join Map, simply right-click and select Delete.
Target Output Columns
Data Mapper Configuration
The Data Mapper is used to map columns from the source data to the target data table.
Inspection and Populating the Mapper
Using the Inspect Source menu button provides additional ways to map columns from source to target:
- Populate Both Mapping Tables: Propagates all values from the source data table into the target data table. This is done by default.
- Populate Source Mapping Table Only: Maps all values in the source data table only. This is helpful when modifying an existing workflow when source column structure has changed.
- Populate Target Mapping Table Only: Propagates all values into the target data table only.
If the source and target column options aren’t enough, other columns can be added into the target data table in several different ways:
- Propagate All will insert all source columns into the target data table, whether they already existed or not.
- Propagate Selected will insert selected source column(s) only.
- Right click on target side and select Insert Row to insert a row immediately above the currently selected row.
- Right click on target side and select Append Row to insert a row at the bottom (far right) of the target data table.
Deleting Columns
To delete columns from the target data table, select the desired column(s), then right click and select Delete.
Changing Column Order
To rearrange columns in the target data table, select the desired column(s). You can use either:
- Bulk Move Arrows: Select the desired move option from the arrows in the upper right
- Context Menu: Right clikc and select Move to Top, Move Up, Move Down, or Move to Bottom.
Reduce Result to Distinct Records Only
To return only distinct options, select the Distinct menu option. This will toggle a set of checkboxes for each column in the source. Simply check any box next to the corresponding column to return only distinct results.
Depending on the situation, you may want to consider use of Summarization instead.
The distinct process retains the first unique record found and discards the rest. You may want to apply a sort on the data if it is important for consistency between runs.
Aggregation and Grouping
To aggregate results, select the Summarize menu option. This will toggle a set of select boxes for each column in the target data table. Choose an appropriate summarization method for each column.
- Group By
- Sum
- Min
- Max
- First
- Last
- Count
- Count (including nulls)
- Mean
- Standard Deviation
- Sample Standard Deviation
- Population Standard Deviation
- Variance
- Sample Variance
- Population Variance
- Advanced Non-Group_By
For advanced data mapper usage such as expressions, cleaning, and constants, please see the Advanced Data Mapper Usage
Output Filters
To allow for maximum flexibility, data filters are available on the source data and the target data. For larger data sets, it can be especially beneficial to filter out rows on the source so the remaining operations are performed on a smaller data set.
Select Subset Of Data
This filter type provides a way to filter the inbound source data based on the specified conditions.
Apply Secondary Filter To Result Data
This filter type provides a way to apply a filter to the post-transformed result data based on the specified conditions. The ability to apply a filter on the post-transformed result allows for exclusions based on results of complex calcuations, summarizaitons, or window functions.
Final Data Table Slicing (Limit)
The row slicing capability provides the ability to limit the rows in the result set based on a range and starting point.
Filter Syntax
The filter syntax utilizes Python SQLAlchemy which is the same syntax as other expressions.
View examples and expression functions in the Expressions area.
Examples
Lookup Product Dimension Information
In this example, the modeler needs information from the product dimension table to make sense of the order fact table. As such, the Import Order Fact table is selected as the Source Table. The Import Product Dim table contains the desired lookup information, so it’s selected as the Lookup Table Source. Although available, no filters are applied to the lookup data table (nor any other data tables, for that matter).
In the Table Data Selection section, all columns are mapped from the source data table to the target data table.
No Data Filters are applied to either source or target data.
Lastly, the source data table is matched to the lookup data table using the Product_ID field found in each table. Only the Product_Description and Unit_Cost columns are appended to the target data table, with Unit_Cost being renamed to Retail_Unit_Cost in the process.
In the resulting target data table, the Product_Description and Retail_Unit_Cost columns have been added, based on matching values in the Product_ID column.
13 - Table Melt
Description
Used to convert short, wide data tables into long, narrow data tables. Selected columns are transposed, with the column names converted into values across multiple rows.
Perhaps the easiest example to understand is to think of a data table with months listed as column headers:
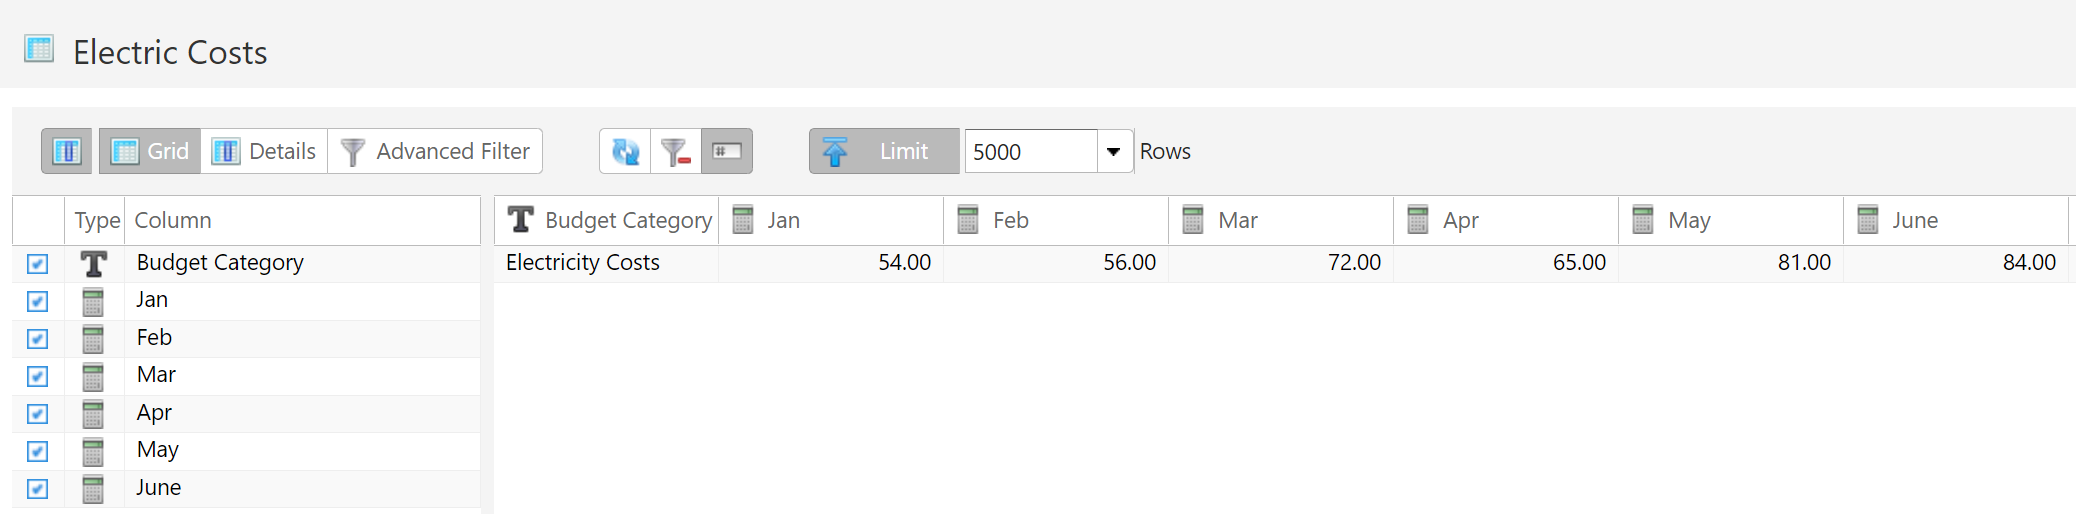
Melting this data table would convert all of the month columns into rows.
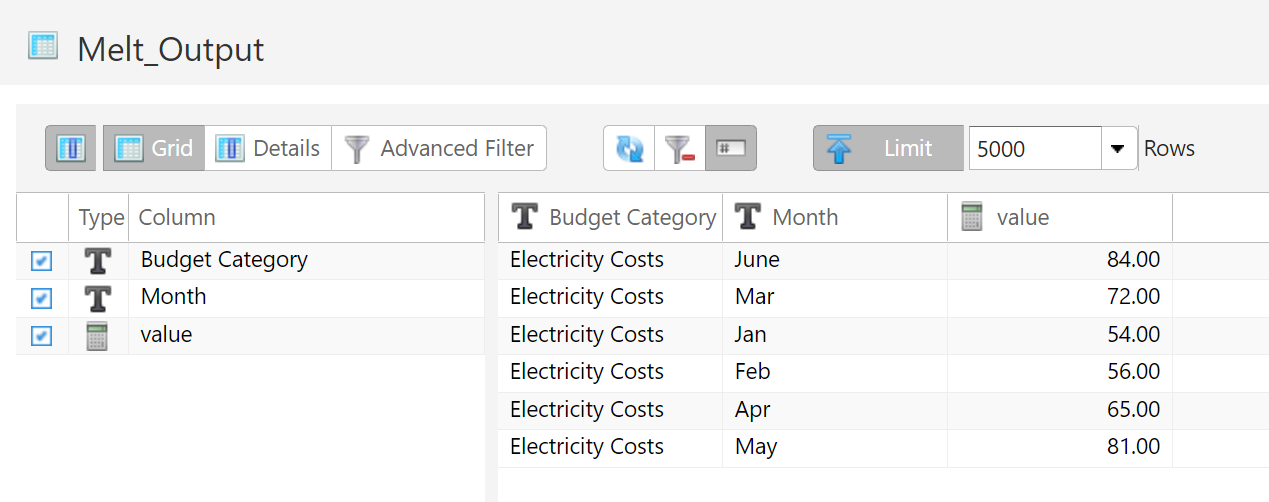
By specifying which columns to transpose and which columns to leave alone, this becomes a powerful tool. Making this conversion in other ETL tools could require a dozen more steps.
Source and Target Parameters
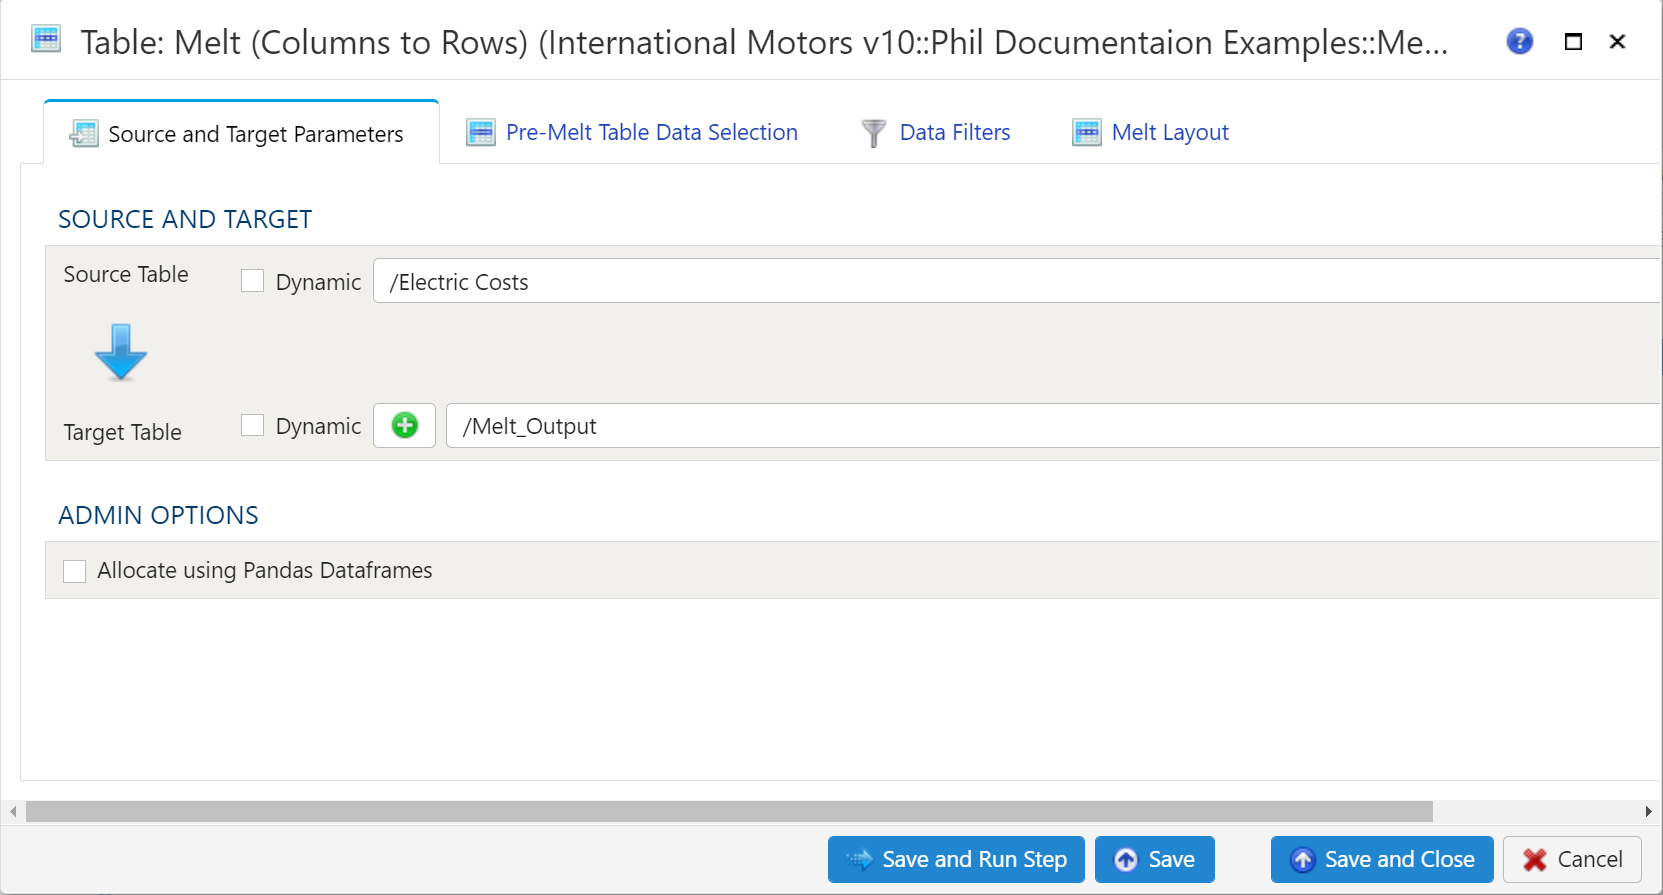
Source and Target
To establish the source and target, first select the data table to be extracted from the Source Table dropdown menu.
Target Table
To establish the target table select either an existing table as the target table using the Target Table dropdown or click on the green "+" sign to create a new table as the target.
Table Creation
When creating a new table you will have the option to either create it as a View or as a Table.
Views:
Views are useful in that the time required for a step to execute is significantly less than when a table is used. The downside of views is they are not a useful for data exploration in the table Details mode.
Tables:
When using a table as the target a step will take longer to execute but data exploration in the Details mode is much quicker than with a view.
Pre-Melt Table Data Selection
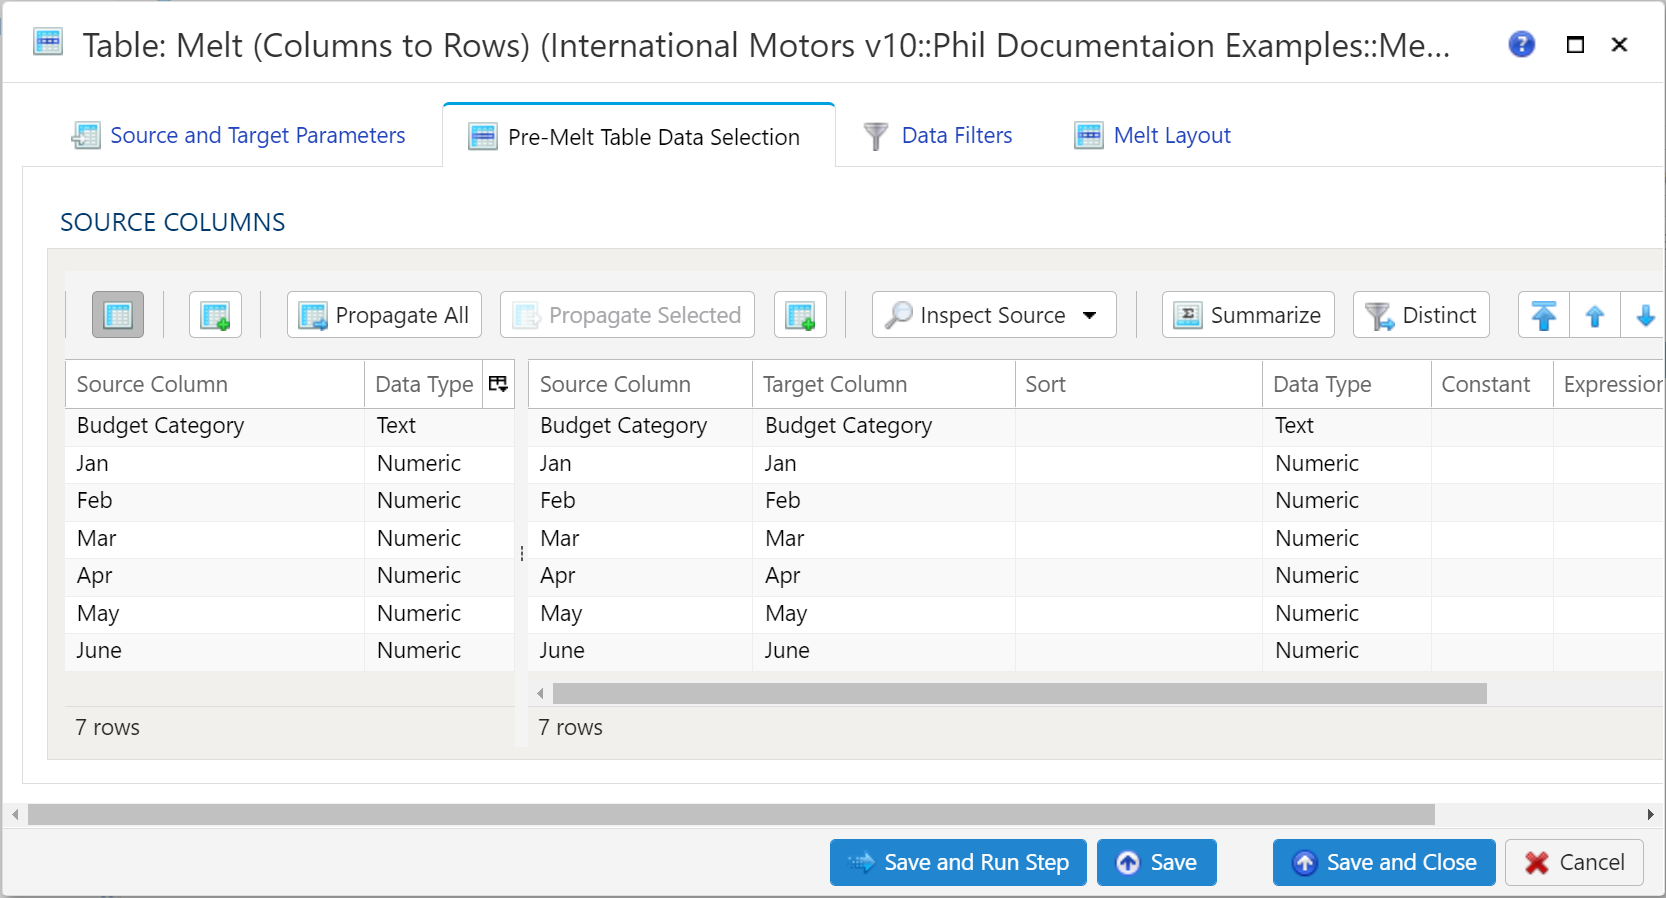
This section is a bit different from the standard Table Data Selection. Basically this is used to specify which columns are to be used in the Melt operation. This includes ID columns and Variable/Value columns.
For more details regarding Table Data Selection, see details here: Table Data Selection
Data Filters
To allow for maximum flexibility, data filters are available on the source data and the target data. For larger data sets, it can be especially beneficial to filter out rows on the source so the remaining operations are performed on a smaller data set.
Select Subset of Source Data
Any valid Python expression is acceptable to subset the data. Please see Expressions
for more details and examples.
Apply Secondary Filter To Result Data
Any valid Python expression is acceptable to subset the data. Please see Expressions for more details and examples
Final Data Table Slicing (Limit)
To limit the data, simply check the Apply Row Slicer box and then specify the following:
- Initial Rows to Skip: Rows of data to skip (column header row is not included in count)
- End at Row: Last row of data to include. This is different from simply counting rows at the end to drop
Melt Layout
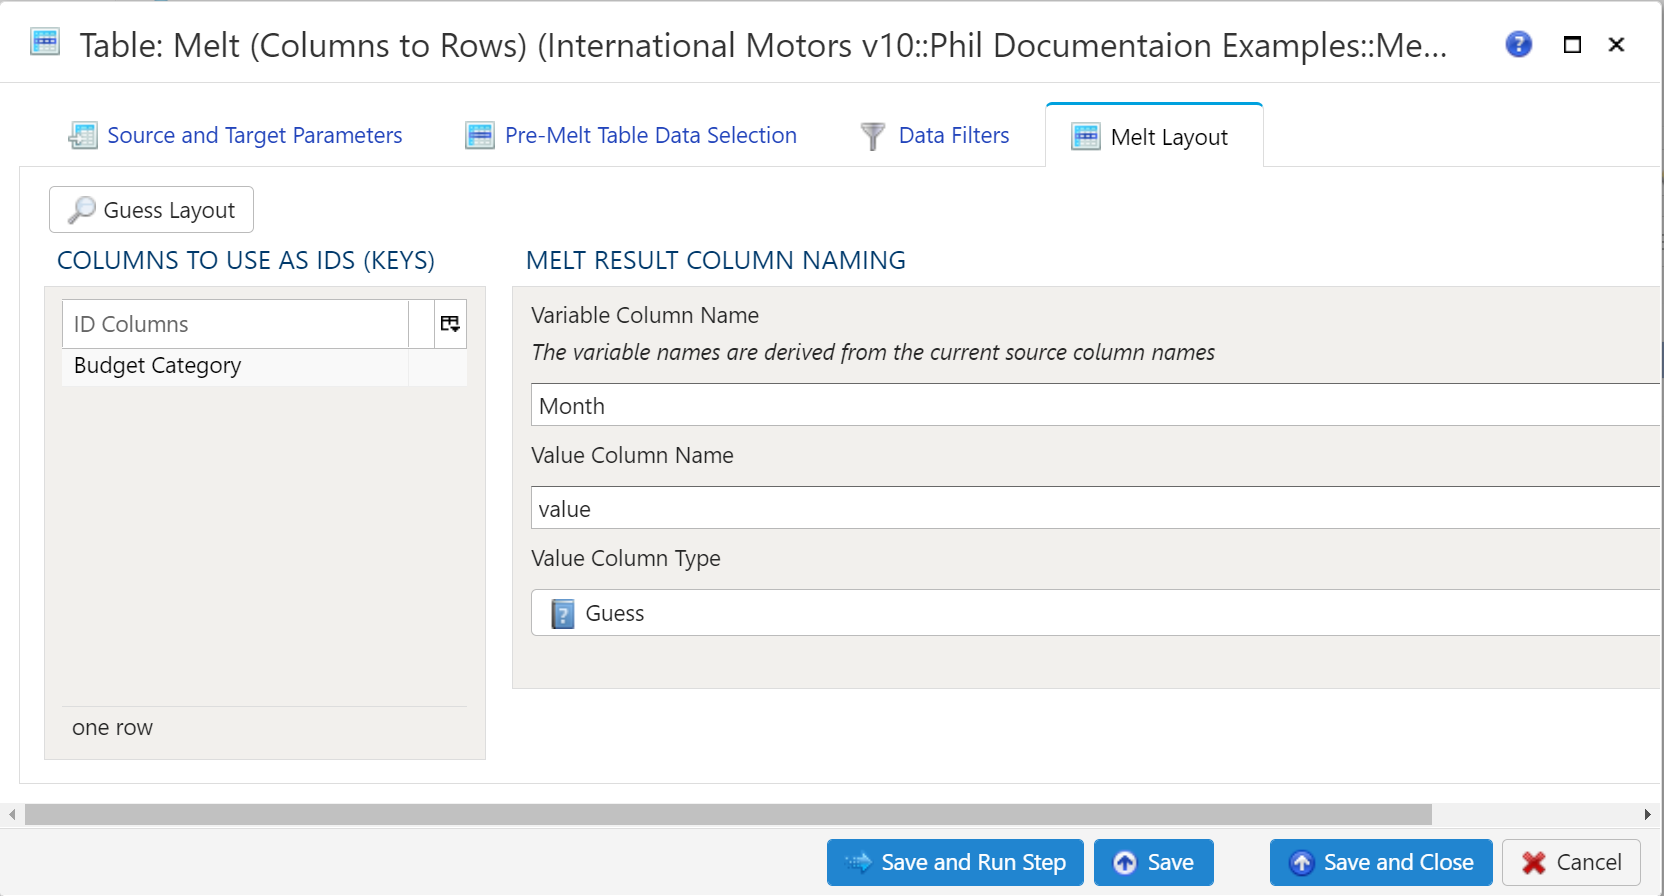
There is a Guess Layout button available to allow Analyze a first crack at specifying ID columns. By default, all text (data type of String) columns are placed in the Keys section. Numeric columns are not placed into Keys by default, but they are allowed to be there based on the model’s needs.
Columns to Use as IDs (Keys)
ID columns are the columns which remain in tact. These columns are effectively repeated for every instance of a variable/value combination. For a monthly table, this would result in 12 repetitions of ID columns.
ID columns can be added automatically or manually. To add the columns automatically, use the aforementioned Guess Layout button. To add additional columns manually, right click anywhere in the section and select either Insert Row or Append Row, to add a row prior to the currently selected row or to add a row at the end, respectively. Then, type the column name to use as an ID.
To remove a field from the IDs, simply right-click and select Delete.
Melt Result Column Naming
There are 2 values to specify. Both of these values will become column names in the target data table.
- Variable Column Name: As specified in the transform, The variable names are derived from the current source column names. Essentially, specify a column name which will represent the data originally represented in the source data table columns.
- Value Column Name: Specify a column name to represent the data represented within the source data table. Typically this will be a numerical unit: Dollars, Pounds, Degrees, Percent, etc.
Examples
In the abouve documentation.
14 - Table Outer Join
Description
Use, as you might have expected, to perform a full outer join operation on 2 data tables, combining them into a single data table based upon the join key(s) specified.
For more details on outer join methodology, see here: Wikipedia SQL Full Outer Join
Table Data Selection
Table Source
Specify the source data table by selecting it from the dropdown menu.
Source Columns
Specify any columns to be included here. Selecting the Inspect Source and Populate Source Mapping Table buttons will make these columns available for the join operation.
Select Subset of Source Data
Any valid Python expression is acceptable to subset the data. Please see Expressions for more details and examples.
Table Output
Target Table
To establish the target table select either an existing table as the target table using the Target Table dropdown or click on the green "+" sign to create a new table as the target.
Table Creation
When creating a new table you will have the option to either create it as a View or as a Table.
Views:
Views are useful in that the time required for a step to execute is significantly less than when a table is used. The downside of views is they are not a useful for data exploration in the table Details mode.
Tables:
When using a table as the target a step will take longer to execute but data exploration in the Details mode is much quicker than with a view.
Join Map
Specify join conditions. Using the Guess button will find all matching columns from both Table 1 as well as Table 2. To add additional columns manually, right click anywhere in the section and select either Insert Row or Append Row, to add a row prior to the currently selected row or to add a row at the end, respectively. Then, type the column names to match from Table 1 to Table 2. To remove a field from the Join Map, simply right-click and select Delete.
Target Output Columns
Data Mapper Configuration
The Data Mapper is used to map columns from the source data to the target data table.
Inspection and Populating the Mapper
Using the Inspect Source menu button provides additional ways to map columns from source to target:
- Populate Both Mapping Tables: Propagates all values from the source data table into the target data table. This is done by default.
- Populate Source Mapping Table Only: Maps all values in the source data table only. This is helpful when modifying an existing workflow when source column structure has changed.
- Populate Target Mapping Table Only: Propagates all values into the target data table only.
If the source and target column options aren’t enough, other columns can be added into the target data table in several different ways:
- Propagate All will insert all source columns into the target data table, whether they already existed or not.
- Propagate Selected will insert selected source column(s) only.
- Right click on target side and select Insert Row to insert a row immediately above the currently selected row.
- Right click on target side and select Append Row to insert a row at the bottom (far right) of the target data table.
Deleting Columns
To delete columns from the target data table, select the desired column(s), then right click and select Delete.
Changing Column Order
To rearrange columns in the target data table, select the desired column(s). You can use either:
- Bulk Move Arrows: Select the desired move option from the arrows in the upper right
- Context Menu: Right clikc and select Move to Top, Move Up, Move Down, or Move to Bottom.
Reduce Result to Distinct Records Only
To return only distinct options, select the Distinct menu option. This will toggle a set of checkboxes for each column in the source. Simply check any box next to the corresponding column to return only distinct results.
Depending on the situation, you may want to consider use of Summarization instead.
The distinct process retains the first unique record found and discards the rest. You may want to apply a sort on the data if it is important for consistency between runs.
Aggregation and Grouping
To aggregate results, select the Summarize menu option. This will toggle a set of select boxes for each column in the target data table. Choose an appropriate summarization method for each column.
- Group By
- Sum
- Min
- Max
- First
- Last
- Count
- Count (including nulls)
- Mean
- Standard Deviation
- Sample Standard Deviation
- Population Standard Deviation
- Variance
- Sample Variance
- Population Variance
- Advanced Non-Group_By
For advanced data mapper usage such as expressions, cleaning, and constants, please see the Advanced Data Mapper Usage
Output Filters
To allow for maximum flexibility, data filters are available on the source data and the target data. For larger data sets, it can be especially beneficial to filter out rows on the source so the remaining operations are performed on a smaller data set.
Select Subset Of Data
This filter type provides a way to filter the inbound source data based on the specified conditions.
Apply Secondary Filter To Result Data
This filter type provides a way to apply a filter to the post-transformed result data based on the specified conditions. The ability to apply a filter on the post-transformed result allows for exclusions based on results of complex calcuations, summarizaitons, or window functions.
Final Data Table Slicing (Limit)
The row slicing capability provides the ability to limit the rows in the result set based on a range and starting point.
Filter Syntax
The filter syntax utilizes Python SQLAlchemy which is the same syntax as other expressions.
View examples and expression functions in the Expressions area.
Examples
Join Automobile Manufacturers with Models
In this example, consider the following source data tables. First is a list of automobile manufacturers.
| Mfg_ID | Manufacturer |
|---|---|
| 1 | Aston Martin |
| 2 | Porsche |
| 3 | Lamborghini |
| 4 | Ferrari |
| 5 | Koenigsegg |
Next is a list of automobile models with a manufacturer ID. Note that there are several models with no manufacturer.
| ModelName | Mfg_ID |
|---|---|
| Aventador | 3 |
| Countach | 3 |
| DBS | 1 |
| Enzo | 4 |
| One-77 | 1 |
| Optimus Prime | |
| Batmobile | |
| Agera | 5 |
| Lightning McQueen |
To get a list of models by manufacturer, it makes sense to join on Mfg_ID. By leveraging outer join concepts, the output will also be able to show those items which do not have any matches.
First, specify parameters for Table 1 Data Selection. The source data table is selected and all columns are listed.
Next, specify parameters for Table 2 Data Selection. Once again, the source data table is selected and all columns are listed.
Finally, the join conditions are set in the Table Output tab. Using the Guess button, Analyze properly identifies the Mfg_ID column to use as the Join Key. Lastly, the
Target Output Columns are specified automatically using the Propagate button. This effectively includes all columns from all tables, with any join columns obviously only being included a single time. Note that the columns are sorted alphabetically, first by Manufacturer and next by ModelName.
As expected, the final output includes all rows from both tables, whether they had a match in both tables or not. As such, this time Porsche does indeed show up despite having no models. Additionally, Batmobile, Lightning McQueen, and Optimus Prime are included in the results even though none of them have a manufacturer. Besides, who can say ‘No’ to them?
15 - Table Pivot
Description
Used to convert long, narrow data tables into short, wide data tables. Selected columns are transposed, with the column names converted into values across multiple columns.
Perhaps the easiest example to understand is to think of a data table with months listed as rows:
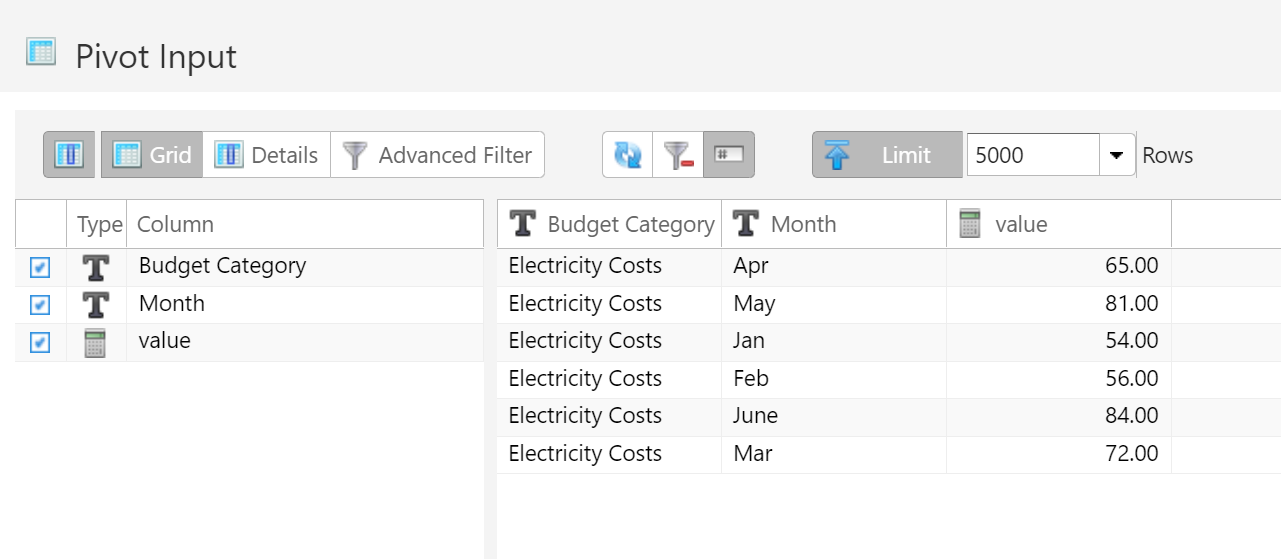
Pivoting this data table would convert all of the month rows into columns.
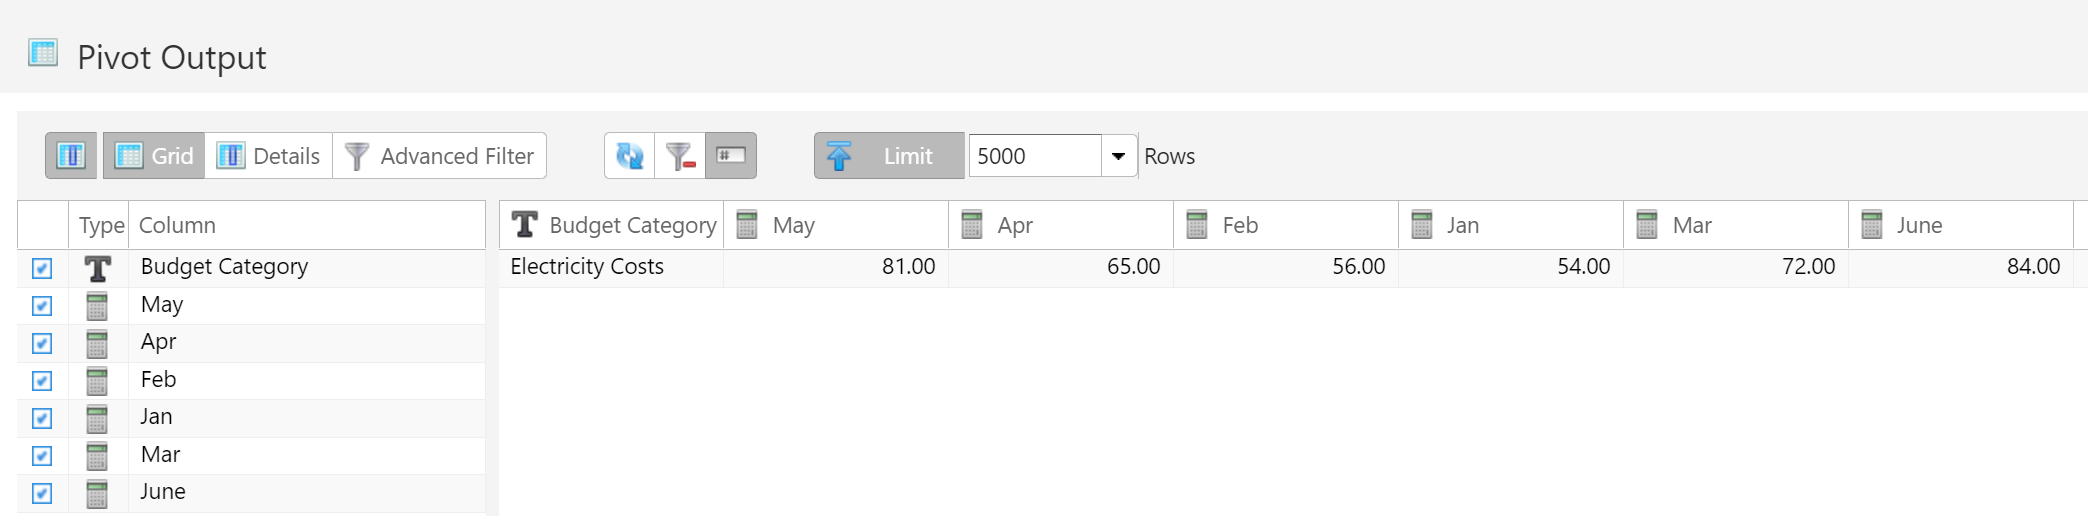
By specifying which columns to transpose and which columns to leave alone, this becomes a powerful tool. Making this conversion in other ETL tools could require a dozen more steps.
Source and Target Parameters
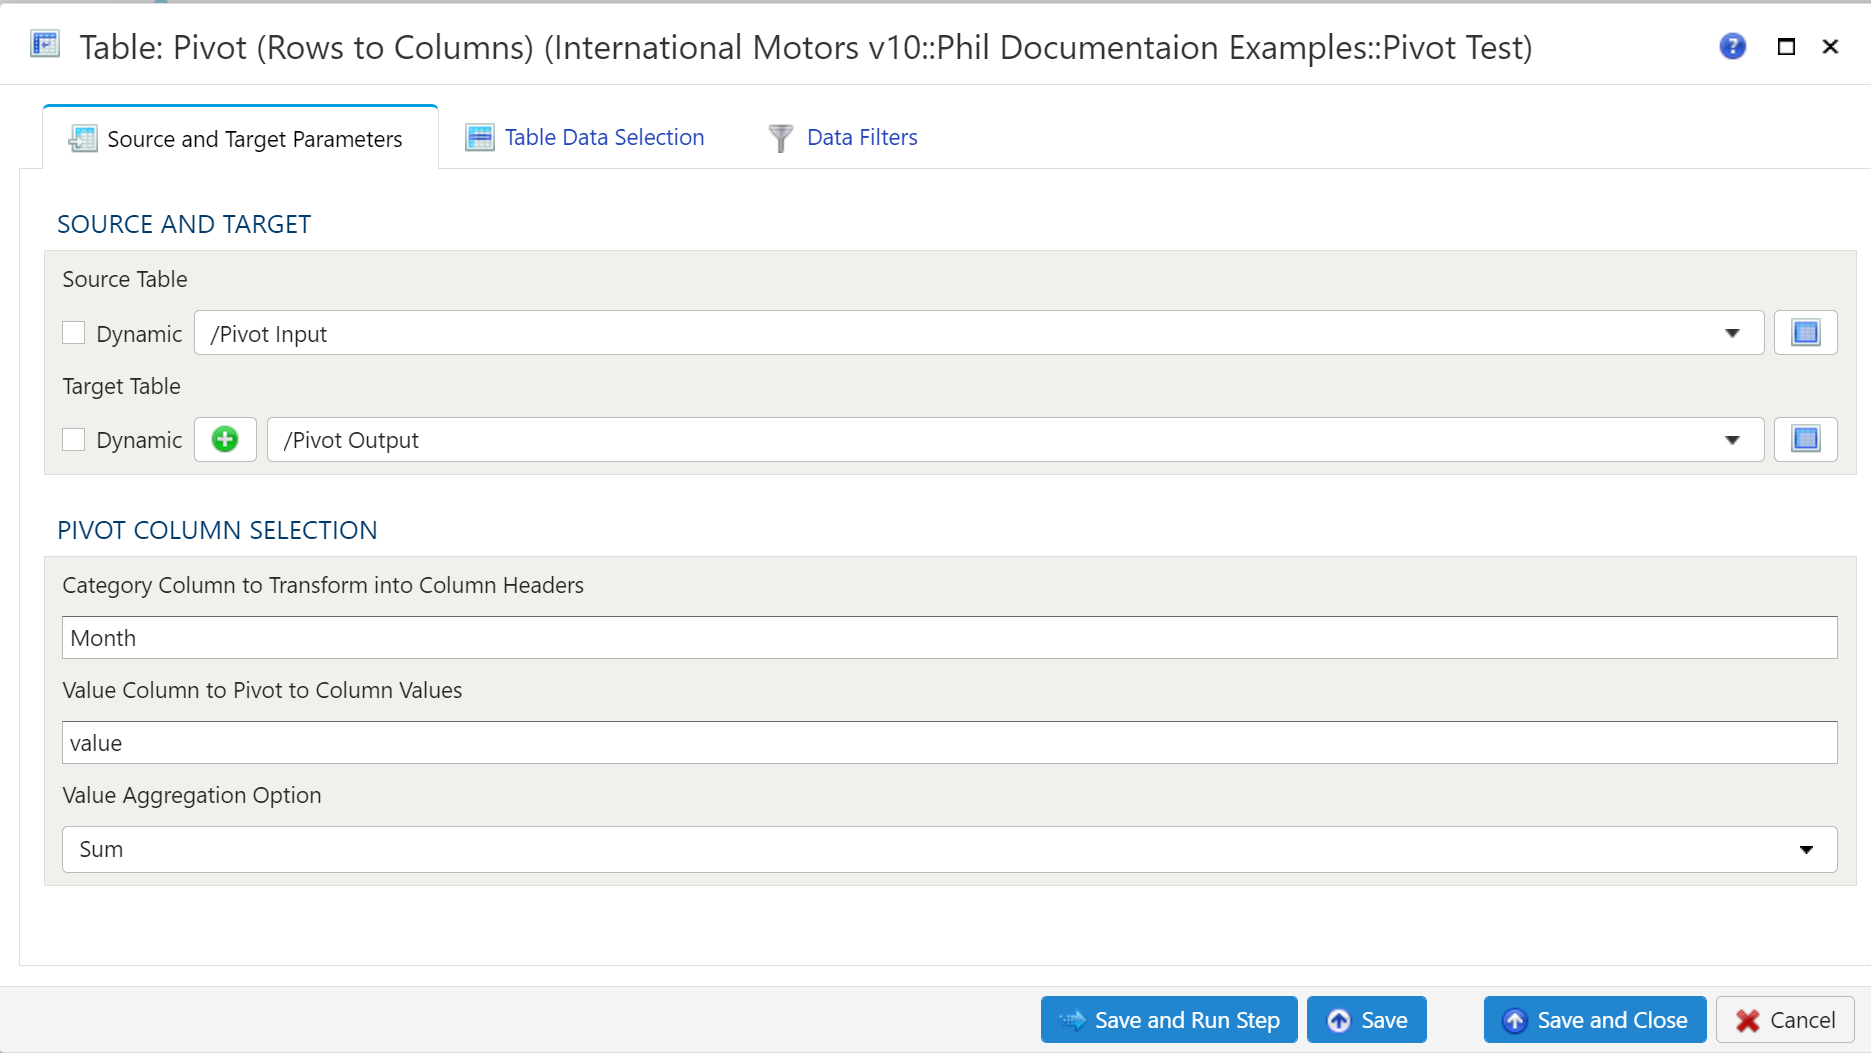
Source Table Selection
To establish the source and target, first select the data table to be extracted from using the dropdown menu.
Traget Table Selection
Target Table
To establish the target table select either an existing table as the target table using the Target Table dropdown or click on the green "+" sign to create a new table as the target.
Table Creation
When creating a new table you will have the option to either create it as a View or as a Table.
Views:
Views are useful in that the time required for a step to execute is significantly less than when a table is used. The downside of views is they are not a useful for data exploration in the table Details mode.
Tables:
When using a table as the target a step will take longer to execute but data exploration in the Details mode is much quicker than with a view.
Pivot Column Selection
The Category Column to Transform into Column Headers is where you specigy the column in Source Table that will be pivoted to rows. The Value Column ti Pivot to Column Vales is the column that containes the values in the Source Table. The Value Aggregation Option is where you specify how you want the data to aggregate.
Table Data Selection
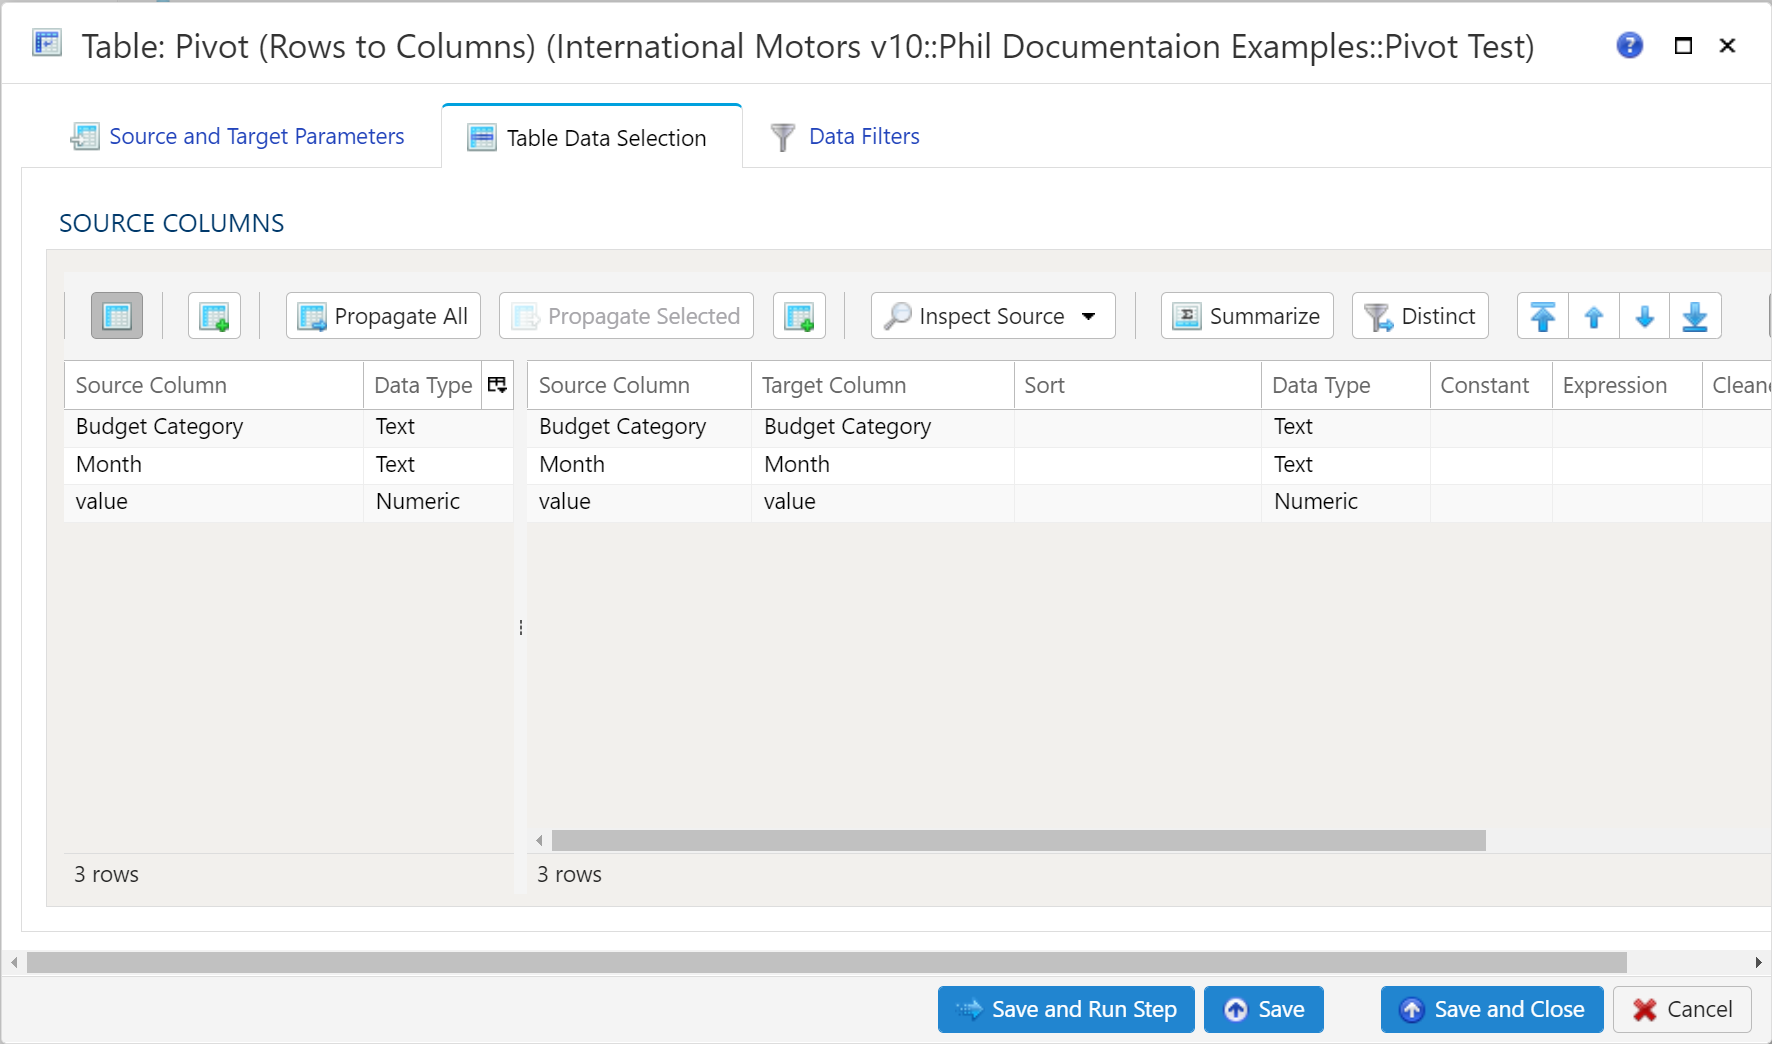
The Table Data Selection tab is used to map columns from the source data table to the target data table. All source columns on the left side of the window are automatically mapped to the target data table depicted on the right side of the window. Using the Inspect Source menu button, there are a few additional ways to map columns from source to target:
- Populate Both Mapping Tables: Propagates all values from the source data table into the target data table. This is by default.
- Populate Source Mapping Table Only: Maps all values in the source data table only. This is helpful when modifying an existing workflow when source column structure has changed.
- Populate Target Mapping Table Only: Propagates all values into the target data table only.
In addition to each of these options, each choice offers the ability to preview the source data.
If the source and target column options aren’t enough, other columns can be added into the target data table in several different ways:
- Propagate All will insert all source columns into the target data table, whether they already existed or not.
- Propagate Selected will insert selected source column(s) only.
- Right click on target side and select Insert Row to insert a row immediately above the currently selected row.
- Right click on target side and select Append Row to insert a row at the bottom (far right) of the target data table.
To delete columns from the target data table, select the desired column(s), then right click and select Delete.
To rearrange columns in the target data table, select the desired column(s), then right click and select Move to Top, Move Up, Move Down, or Move to Bottom.
To return only distinct options, select the Distinct menu option. This will toggle a set of checkboxes for each column in the source. Simply check any box next to the corresponding column to return distinct results only.
To aggregate results, select the Summarize menu option. This will toggle a set of drop down boxes for each column in the target data table. The following summarization options are available:
- Group by (set as default)
- Sum
- Min
- Max
- First
- Last
- Count
- Mean
- Median
- Mode
- Std Dev
- Variance
- Product
- Absolute Val
- Quantile
- Skew
- Kurtosis
- Mean Abs Dev
- Cumulative Sum
- Cumulative Min
- Cumulative Max
- Cumulative Product
For more aggregation details, see the Analyze overview page here.
Data Filters
To allow for maximum flexibility, data filters are available on the source data and the target data. For larger data sets, it can be especially beneficial to filter out rows on the source so the remaining operations are performed on a smaller data set.
Select Subset of Data
Any valid Python expression is acceptable to subset the data. Please see Expressions
for more details and examples.
Apply Secondary Filter To Result Data
Any valid Python expression is acceptable to subset the data. Please see Expressions for more details and examples
Final Data Table Slicing (Limit)
To limit the data, simply check the Apply Row Slicer box and then specify the following:
- Initial Rows to Skip: Rows of data to skip (column header row is not included in count)
- End at Row: Last row of data to include. This is different from simply counting rows at the end to drop
16 - Table Union All
Description
Use to combine multiple data tables with the same column structure into a single data table. For example, time series data is a prime candidate for this transform. The result is all of the records from the combined tables.
Sources
The Sources section serves as a collection of all data tables to append together. Typically, all of the data tables will have the same (or similar) column structure. There are two buttons available to add a data table to the list:
- Insert Row
- Append Row
Additionally, right-clicking in the Select Source to Edit window will display the same options. Right-clicking on a table already added will also display the Delete option.
To execute the transform properly, there will need to be one entry in the Sources section for every source data table to append together. These entries are listed in the order in which they will be appended. To adjust the order, right-clicking on a table will display the following options:
- Move Down (if applicable)
- Move To Bottom (if applicable)
- Move Up (if applicable)
- Move To Top (if applicable)
By default, each source is named New Table, but the modeler is encouraged to provide descriptive names by double-clicking the name and renaming accordingly.
Target Table
By default, the Target Table is left blank. Before naming, note that data tables must follow Linux naming conventions. As such, we recommend that names only consist of alphanumeric characters. Analyze will automatically scrub any invalid characters from the name. Additionally, it will limit the length to 256 characters, so be concise!
Target Table
To establish the target table select either an existing table as the target table using the Target Table dropdown or click on the green "+" sign to create a new table as the target.
Table Creation
When creating a new table you will have the option to either create it as a View or as a Table.
Views:
Views are useful in that the time required for a step to execute is significantly less than when a table is used. The downside of views is they are not a useful for data exploration in the table Details mode.
Tables:
When using a table as the target a step will take longer to execute but data exploration in the Details mode is much quicker than with a view.
Table Data Selection Tab
Source Table
Table Selection
There are two options for selecting the table or in the second option tables to:
The first option is to use the Specific Table dropdown to select the table.
The second is to use the Tables Matching Search option in which you specify the Search Path and Search Text to select the table or tables that match the search criteria. This option is very useful if you have a workflow that creates a series of commonly named tables that that have been saved appending the date.
Source Columns
Data Mapper Configuration
The Data Mapper is used to map columns from the source data to the target data table.
Inspection and Populating the Mapper
Using the Inspect Source menu button provides additional ways to map columns from source to target:
- Populate Both Mapping Tables: Propagates all values from the source data table into the target data table. This is done by default.
- Populate Source Mapping Table Only: Maps all values in the source data table only. This is helpful when modifying an existing workflow when source column structure has changed.
- Populate Target Mapping Table Only: Propagates all values into the target data table only.
If the source and target column options aren’t enough, other columns can be added into the target data table in several different ways:
- Propagate All will insert all source columns into the target data table, whether they already existed or not.
- Propagate Selected will insert selected source column(s) only.
- Right click on target side and select Insert Row to insert a row immediately above the currently selected row.
- Right click on target side and select Append Row to insert a row at the bottom (far right) of the target data table.
Deleting Columns
To delete columns from the target data table, select the desired column(s), then right click and select Delete.
Changing Column Order
To rearrange columns in the target data table, select the desired column(s). You can use either:
- Bulk Move Arrows: Select the desired move option from the arrows in the upper right
- Context Menu: Right clikc and select Move to Top, Move Up, Move Down, or Move to Bottom.
Reduce Result to Distinct Records Only
To return only distinct options, select the Distinct menu option. This will toggle a set of checkboxes for each column in the source. Simply check any box next to the corresponding column to return only distinct results.
Depending on the situation, you may want to consider use of Summarization instead.
The distinct process retains the first unique record found and discards the rest. You may want to apply a sort on the data if it is important for consistency between runs.
Aggregation and Grouping
To aggregate results, select the Summarize menu option. This will toggle a set of select boxes for each column in the target data table. Choose an appropriate summarization method for each column.
- Group By
- Sum
- Min
- Max
- First
- Last
- Count
- Count (including nulls)
- Mean
- Standard Deviation
- Sample Standard Deviation
- Population Standard Deviation
- Variance
- Sample Variance
- Population Variance
- Advanced Non-Group_By
For advanced data mapper usage such as expressions, cleaning, and constants, please see the Advanced Data Mapper Usage
Data Filters
To allow for maximum flexibility, data filters are available on the source data and the target data. For larger data sets, it can be especially beneficial to filter out rows on the source so the remaining operations are performed on a smaller data set.
Select Subset Of Data
This filter type provides a way to filter the inbound source data based on the specified conditions.
Apply Secondary Filter To Result Data
This filter type provides a way to apply a filter to the post-transformed result data based on the specified conditions. The ability to apply a filter on the post-transformed result allows for exclusions based on results of complex calcuations, summarizaitons, or window functions.
Final Data Table Slicing (Limit)
The row slicing capability provides the ability to limit the rows in the result set based on a range and starting point.
Filter Syntax
The filter syntax utilizes Python SQLAlchemy which is the same syntax as other expressions.
View examples and expression functions in the Expressions area.
17 - Table Union Distinct
Description
Use to combine multiple data tables with the same column structure into a single data table. For example, time series data is a prime candidate for this transform. The result is always the distinct set of records after combining the data.
Sources
The Sources section serves as a collection of all data tables to append together. Typically, all of the data tables will have the same (or similar) column structure. There are two buttons available to add a data table to the list:
- Insert Row
- Append Row
Additionally, right-clicking in the Select Source to Edit window will display the same options. Right-clicking on a table already added will also display the Delete option.
To execute the transform properly, there will need to be one entry in the Sources section for every source data table to append together. These entries are listed in the order in which they will be appended. To adjust the order, right-clicking on a table will display the following options:
- Move Down (if applicable)
- Move To Bottom (if applicable)
- Move Up (if applicable)
- Move To Top (if applicable)
By default, each source is named New Table, but the modeler is encouraged to provide descriptive names by double-clicking the name and renaming accordingly.
Target Table
By default, the Target Table is left blank. Before naming, note that data tables must follow Linux naming conventions. As such, we recommend that names only consist of alphanumeric characters. Analyze will automatically scrub any invalid characters from the name. Additionally, it will limit the length to 256 characters, so be concise!
Target Table
To establish the target table select either an existing table as the target table using the Target Table dropdown or click on the green "+" sign to create a new table as the target.
Table Creation
When creating a new table you will have the option to either create it as a View or as a Table.
Views:
Views are useful in that the time required for a step to execute is significantly less than when a table is used. The downside of views is they are not a useful for data exploration in the table Details mode.
Tables:
When using a table as the target a step will take longer to execute but data exploration in the Details mode is much quicker than with a view.
Table Data Selection Tab
Source Table
Table Selection
There are two options for selecting the table or in the second option tables to:
The first option is to use the Specific Table dropdown to select the table.
The second is to use the Tables Matching Search option in which you specify the Search Path and Search Text to select the table or tables that match the search criteria. This option is very useful if you have a workflow that creates a series of commonly named tables that that have been saved appending the date.
Source Columns
Data Mapper Configuration
The Data Mapper is used to map columns from the source data to the target data table.
Inspection and Populating the Mapper
Using the Inspect Source menu button provides additional ways to map columns from source to target:
- Populate Both Mapping Tables: Propagates all values from the source data table into the target data table. This is done by default.
- Populate Source Mapping Table Only: Maps all values in the source data table only. This is helpful when modifying an existing workflow when source column structure has changed.
- Populate Target Mapping Table Only: Propagates all values into the target data table only.
If the source and target column options aren’t enough, other columns can be added into the target data table in several different ways:
- Propagate All will insert all source columns into the target data table, whether they already existed or not.
- Propagate Selected will insert selected source column(s) only.
- Right click on target side and select Insert Row to insert a row immediately above the currently selected row.
- Right click on target side and select Append Row to insert a row at the bottom (far right) of the target data table.
Deleting Columns
To delete columns from the target data table, select the desired column(s), then right click and select Delete.
Changing Column Order
To rearrange columns in the target data table, select the desired column(s). You can use either:
- Bulk Move Arrows: Select the desired move option from the arrows in the upper right
- Context Menu: Right clikc and select Move to Top, Move Up, Move Down, or Move to Bottom.
Reduce Result to Distinct Records Only
To return only distinct options, select the Distinct menu option. This will toggle a set of checkboxes for each column in the source. Simply check any box next to the corresponding column to return only distinct results.
Depending on the situation, you may want to consider use of Summarization instead.
The distinct process retains the first unique record found and discards the rest. You may want to apply a sort on the data if it is important for consistency between runs.
Aggregation and Grouping
To aggregate results, select the Summarize menu option. This will toggle a set of select boxes for each column in the target data table. Choose an appropriate summarization method for each column.
- Group By
- Sum
- Min
- Max
- First
- Last
- Count
- Count (including nulls)
- Mean
- Standard Deviation
- Sample Standard Deviation
- Population Standard Deviation
- Variance
- Sample Variance
- Population Variance
- Advanced Non-Group_By
For advanced data mapper usage such as expressions, cleaning, and constants, please see the Advanced Data Mapper Usage
Data Filters
To allow for maximum flexibility, data filters are available on the source data and the target data. For larger data sets, it can be especially beneficial to filter out rows on the source so the remaining operations are performed on a smaller data set.
Select Subset Of Data
This filter type provides a way to filter the inbound source data based on the specified conditions.
Apply Secondary Filter To Result Data
This filter type provides a way to apply a filter to the post-transformed result data based on the specified conditions. The ability to apply a filter on the post-transformed result allows for exclusions based on results of complex calcuations, summarizaitons, or window functions.
Final Data Table Slicing (Limit)
The row slicing capability provides the ability to limit the rows in the result set based on a range and starting point.
Filter Syntax
The filter syntax utilizes Python SQLAlchemy which is the same syntax as other expressions.
View examples and expression functions in the Expressions area.
18 - Table Upsert
Description
Performs an update of existing records and append new ones.
Upsert Parameters
To establish the source and target tables, first select the data table to be extracted from using the Source Table dropdown menu. Next, select an existing table as the target table using the Target Table dropdown.
Source Table Data Selection
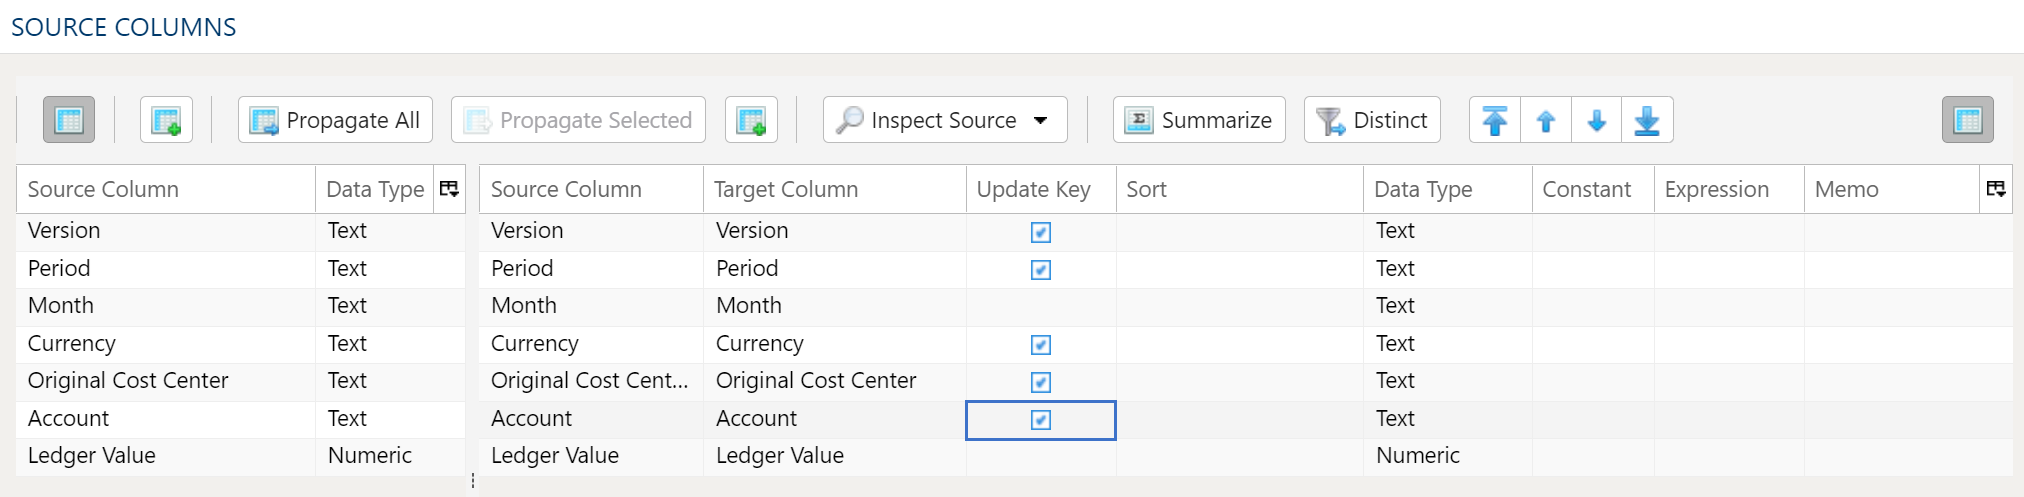
The Data Mapper is used to map columns from the source data to the target data table.
Inspection and Populating the Mapper
Using the Inspect Source menu button provides additional ways to map columns from source to target:
- Populate Both Mapping Tables: Propagates all values from the source data table into the target data table. This is done by default.
- Populate Source Mapping Table Only: Maps all values in the source data table only. This is helpful when modifying an existing workflow when source column structure has changed.
- Populate Target Mapping Table Only: Propagates all values into the target data table only.
If the source and target column options aren’t enough, other columns can be added into the target data table in several different ways:
- Propagate All will insert all source columns into the target data table, whether they already existed or not.
- Propagate Selected will insert selected source column(s) only.
- Right click on target side and select Insert Row to insert a row immediately above the currently selected row.
- Right click on target side and select Append Row to insert a row at the bottom (far right) of the target data table.
Deleting Columns
To delete columns from the target data table, select the desired column(s), then right click and select Delete.
Changing Column Order
To rearrange columns in the target data table, select the desired column(s). You can use either:
- Bulk Move Arrows: Select the desired move option from the arrows in the upper right
- Context Menu: Right clikc and select Move to Top, Move Up, Move Down, or Move to Bottom.
Reduce Result to Distinct Records Only
To return only distinct options, select the Distinct menu option. This will toggle a set of checkboxes for each column in the source. Simply check any box next to the corresponding column to return only distinct results.
Depending on the situation, you may want to consider use of Summarization instead.
The distinct process retains the first unique record found and discards the rest. You may want to apply a sort on the data if it is important for consistency between runs.
Update Key
In order for the Upsert to update the existing and append new records you need to select the columns in the data that create a unique key.
Source Data Filters
To allow for maximum flexibility, data filters are available on the source data and the target data. For larger data sets, it can be especially beneficial to filter out rows on the source so the remaining operations are performed on a smaller data set.
Select Subset Of Data
This filter type provides a way to filter the inbound source data based on the specified conditions.
Apply Secondary Filter To Result Data
This filter type provides a way to apply a filter to the post-transformed result data based on the specified conditions. The ability to apply a filter on the post-transformed result allows for exclusions based on results of complex calcuations, summarizaitons, or window functions.
Final Data Table Slicing (Limit)
The row slicing capability provides the ability to limit the rows in the result set based on a range and starting point.
Filter Syntax
The filter syntax utilizes Python SQLAlchemy which is the same syntax as other expressions.
View examples and expression functions in the Expressions area.