This is the multi-page printable view of this section. Click here to print.
Export Steps
1 - Export to CSV
Description
Export an Analyze data table to PlaidCloud Document as a CSV delimited file.
Export Parameters
Export File Selector
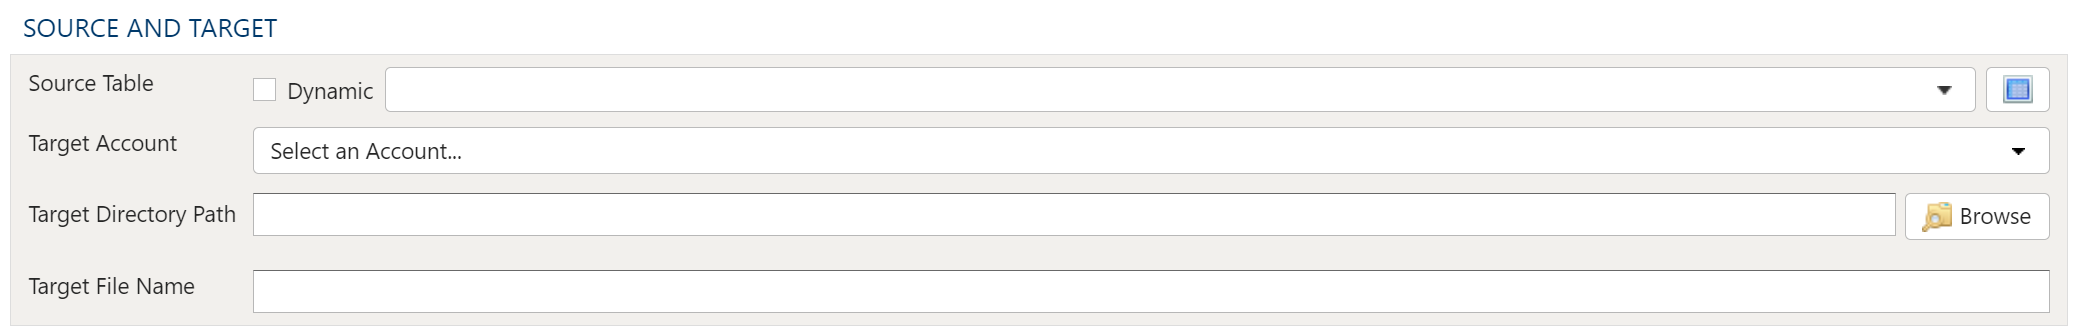
The file selector in this transform allows you to choose a destination store the exported result in a PlaidCloud Document.
You choose a directory and specify a file name for the target file.
Source Table
Dynamic Option
The Dynamic option allows specification of a table using text, including variables. This is useful when employing variable driven workflows where table and view references are relative to the variables specified.
An example that uses the current_month variable to dynamically point to source table:
legal_entity/inputs/{current_month}/ledger_values
Static Option
When a specific table is desired as the source for the export, leave the Dynamic box unchecked and select the source table.
Table Explorer is always avaible with any table selection. Click on the Table Explorer button to the right of the table selection and a Table Explorer window will open.
Selecting a Document Account
Choose a PlaidCloud Document account for which you have access. This will provide you with the ability to select a directory next selection.
Target Directory Path
Select the Browse icon to the right of the Target Directory Path and navigate to the location you want the file saved to.
Target File Name
Specify the name the exported file should be saved as.
Selecting File Compression
All exported files are uncompressed, but the following compression options are available:
- No Compression
- Zip
- GZip
- BZip2
Data Format
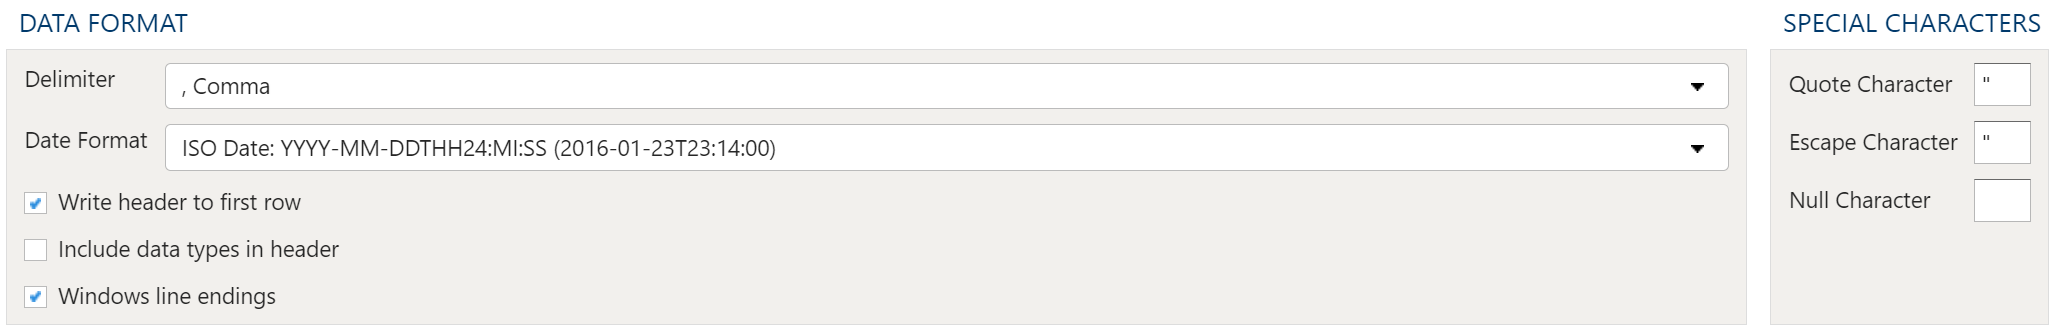
Delimiter
The Export CSV transform is used to export data tables into delimited text files saved in PlaidCloud Document. This includes, but is not limited to, the following delimiter types:
Excel CSV (comma separated)
Excel TSV (tab separated)
User Defined Separator –>
- comma (,)
- pipe (|)
- semicolon (;)
- tab
- space ( )
- other/custom (tilde, dash, etc)
To specify a custom delimiter, select User Defined Separator –> and then Other –>, and type the custom delimiter into the text box.
Special Characters
The Special Characters section allows users to specify how to handle data with quotation marks and escape characters. Choose from the following settings:
- Special Characters (QUOTE_MINIMAL): Quote fields with special characters (anything that would confuse a parser configured with the same dialect and options). This is the default setting.
- All (QUOTE_ALL): Quote everything, regardless of type.
- Non-Numeric (QUOTE_NONNUMERIC): Quote all fields that are not integers or floats. When used with the reader, input fields that are not quoted are converted to floats.
- None (QUOTE_NONE): Do not quote anything on output. Quote characters are included in output with the escape character provided by the user. Note that only a single escape character can be provided.
Write Header To First Row
If this checkbox is selected the table headers will be exported to the first row. If it is not there will be no headers in the exported file.
Include Data Types In Headers
If this checkbox is selected the headers of the exported file will contain the data type for the column.
Windows Line Endings
Lastly, the Use Windows Compatible Line Endings checkbox is selected by default to ensure compatibility with Windows systems. It is advisable to leave this setting on unless working in a unix-only environment.
Table Data Selection
Data Mapper Configuration
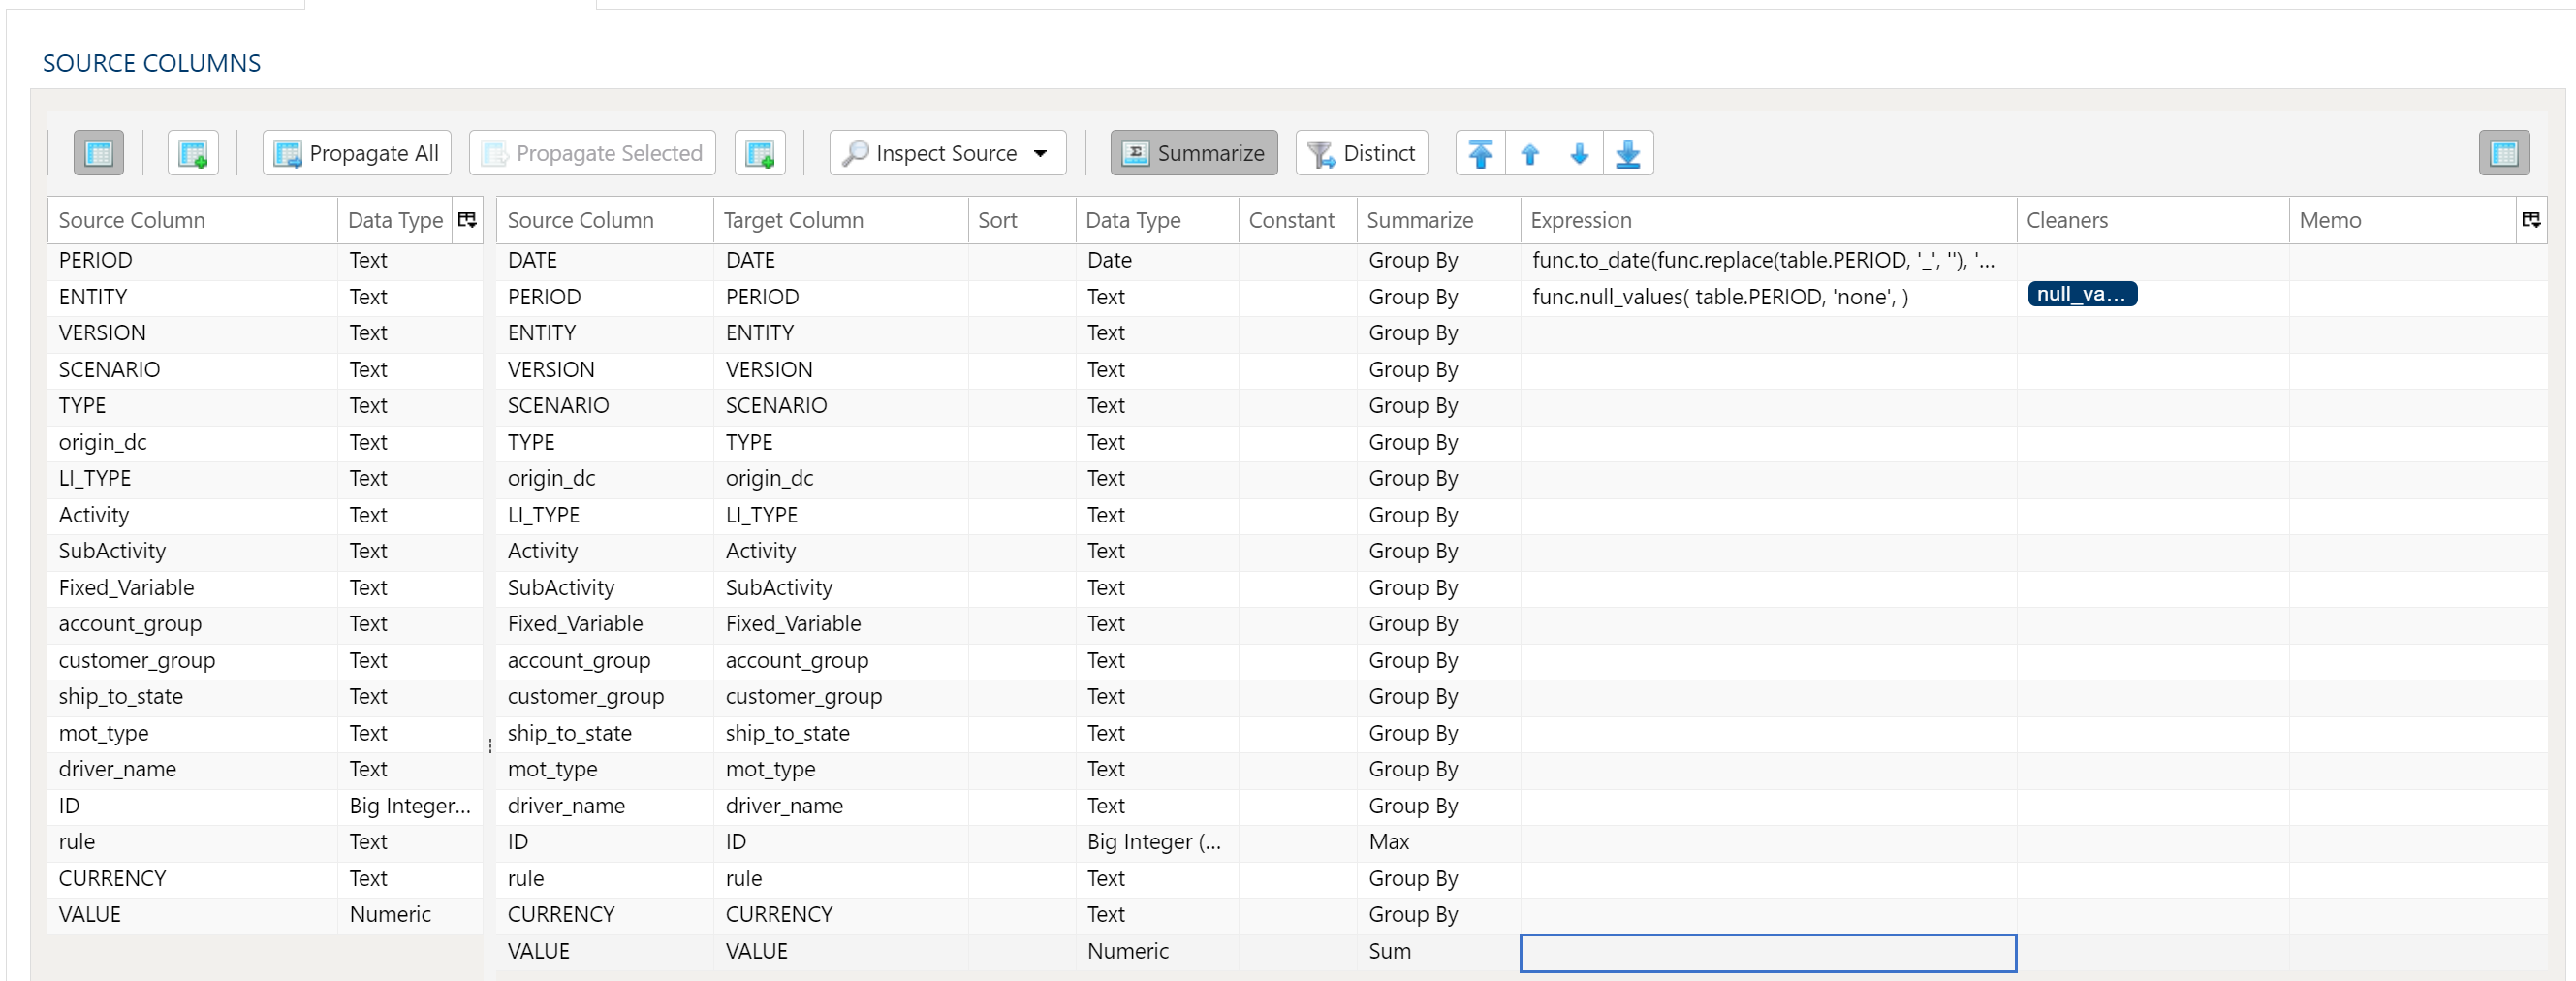
The Data Mapper is used to map columns from the source data to the target data table.
Inspection and Populating the Mapper
Using the Inspect Source menu button provides additional ways to map columns from source to target:
- Populate Both Mapping Tables: Propagates all values from the source data table into the target data table. This is done by default.
- Populate Source Mapping Table Only: Maps all values in the source data table only. This is helpful when modifying an existing workflow when source column structure has changed.
- Populate Target Mapping Table Only: Propagates all values into the target data table only.
If the source and target column options aren’t enough, other columns can be added into the target data table in several different ways:
- Propagate All will insert all source columns into the target data table, whether they already existed or not.
- Propagate Selected will insert selected source column(s) only.
- Right click on target side and select Insert Row to insert a row immediately above the currently selected row.
- Right click on target side and select Append Row to insert a row at the bottom (far right) of the target data table.
Deleting Columns
To delete columns from the target data table, select the desired column(s), then right click and select Delete.
Changing Column Order
To rearrange columns in the target data table, select the desired column(s). You can use either:
- Bulk Move Arrows: Select the desired move option from the arrows in the upper right
- Context Menu: Right clikc and select Move to Top, Move Up, Move Down, or Move to Bottom.
Reduce Result to Distinct Records Only
To return only distinct options, select the Distinct menu option. This will toggle a set of checkboxes for each column in the source. Simply check any box next to the corresponding column to return only distinct results.
Depending on the situation, you may want to consider use of Summarization instead.
The distinct process retains the first unique record found and discards the rest. You may want to apply a sort on the data if it is important for consistency between runs.
Aggregation and Grouping
To aggregate results, select the Summarize menu option. This will toggle a set of select boxes for each column in the target data table. Choose an appropriate summarization method for each column.
- Group By
- Sum
- Min
- Max
- First
- Last
- Count
- Count (including nulls)
- Mean
- Standard Deviation
- Sample Standard Deviation
- Population Standard Deviation
- Variance
- Sample Variance
- Population Variance
- Advanced Non-Group_By
For advanced data mapper usage such as expressions, cleaning, and constants, please see the Advanced Data Mapper Usage
For more aggregation details, see the Analyze overview page here.
Data Filters
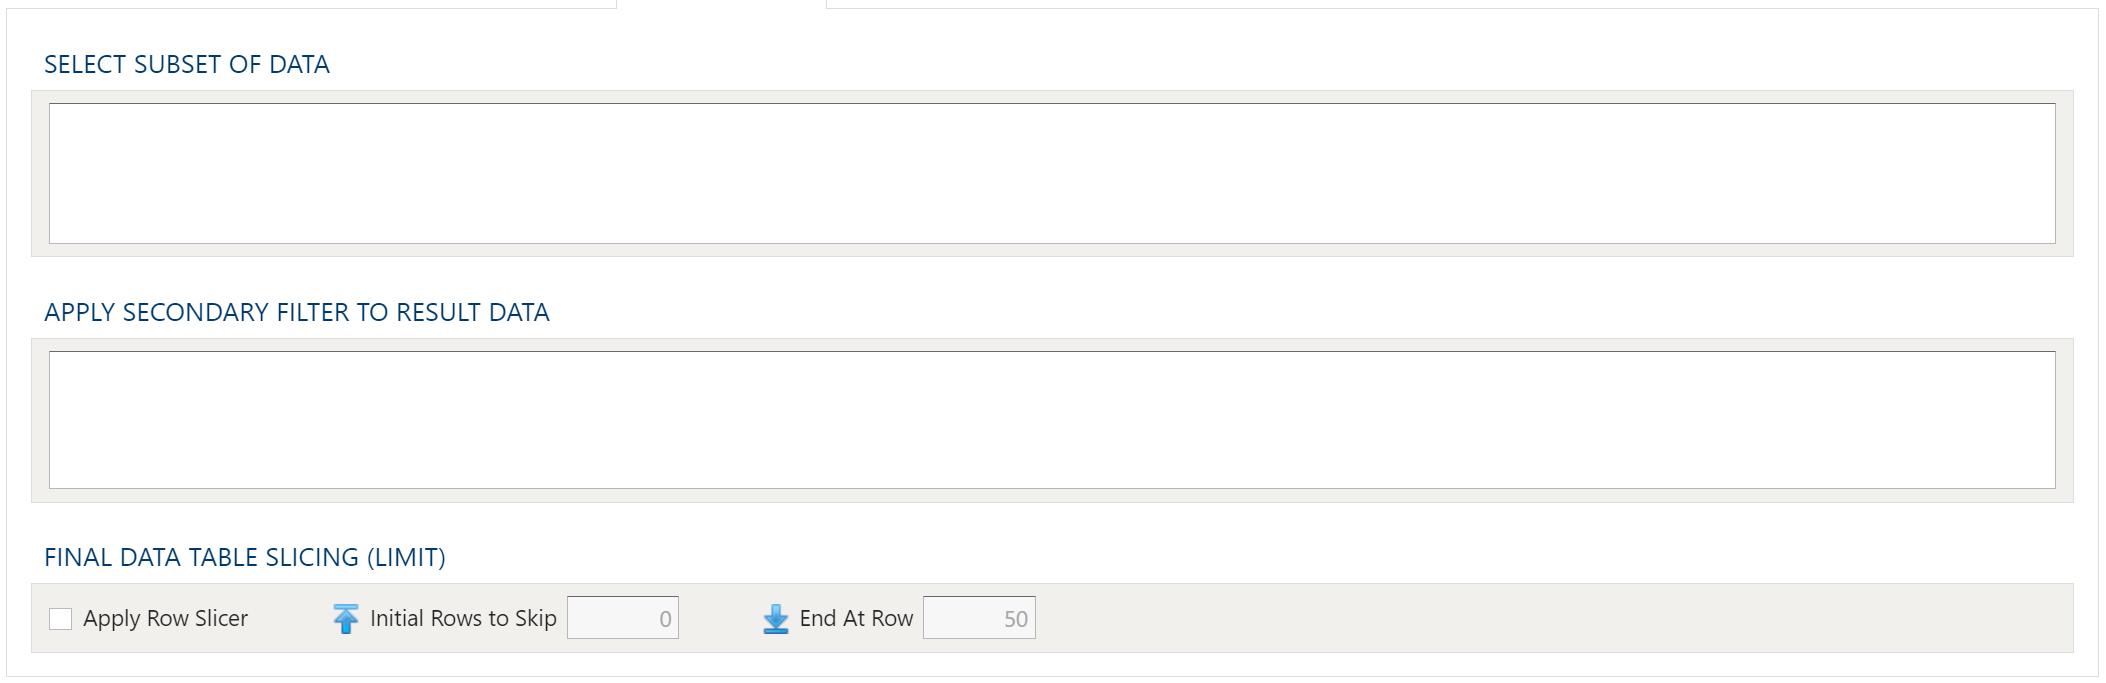
To allow for maximum flexibility, data filters are available on the source data and the target data. For larger data sets, it can be especially beneficial to filter out rows on the source so the remaining operations are performed on a smaller data set.
Select Subset Of Data
This filter type provides a way to filter the inbound source data based on the specified conditions.
Apply Secondary Filter To Result Data
This filter type provides a way to apply a filter to the post-transformed result data based on the specified conditions. The ability to apply a filter on the post-transformed result allows for exclusions based on results of complex calcuations, summarizaitons, or window functions.
Final Data Table Slicing (Limit)
The row slicing capability provides the ability to limit the rows in the result set based on a range and starting point.
Filter Syntax
The filter syntax utilizes Python SQLAlchemy which is the same syntax as other expressions.
View examples and expression functions in the Expressions area.
Examples
No examples yet...
2 - Export to Excel
Description
Export an Analyze data table to PlaidCloud Document as a Microsoft Excel file. PlaidCloud Analyze supports modern versions of Microsoft Excel (2007-2016) as well as legacy versions (2000/2003).
Export Parameters
Export File Selector
The file selector in this transform allows you to choose a destination store the exported result in a PlaidCloud Document.
You choose a directory and specify a file name for the target file.
Source Table
Dynamic Option
The Dynamic option allows specification of a table using text, including variables. This is useful when employing variable driven workflows where table and view references are relative to the variables specified.
An example that uses the current_month variable to dynamically point to source table:
legal_entity/inputs/{current_month}/ledger_values
Static Option
When a specific table is desired as the source for the export, leave the Dynamic box unchecked and select the source table.
Table Explorer is always avaible with any table selection. Click on the Table Explorer button to the right of the table selection and a Table Explorer window will open.
Selecting a Document Account
Choose a PlaidCloud Document account for which you have access. This will provide you with the ability to select a directory next selection.
Target Directory Path
Select the Browse icon to the right of the Target Directory Path and navigate to the location you want the file saved to.
Target File Name
Specify the name the exported file should be saved as.
Target Sheet Name
Specify the target sheet name, the default is Sheet1
Selecting File Compression
All exported files are uncompressed, but the following compression options are available:
- No Compression
- Zip
- GZip
- BZip2
Write Header To First Row
If this checkbox is selected the table headers will be exported to the first row. If it is not there will be no headers in the exported file.
Table Data Selection
Data Mapper Configuration
The Data Mapper is used to map columns from the source data to the target data table.
Inspection and Populating the Mapper
Using the Inspect Source menu button provides additional ways to map columns from source to target:
- Populate Both Mapping Tables: Propagates all values from the source data table into the target data table. This is done by default.
- Populate Source Mapping Table Only: Maps all values in the source data table only. This is helpful when modifying an existing workflow when source column structure has changed.
- Populate Target Mapping Table Only: Propagates all values into the target data table only.
If the source and target column options aren’t enough, other columns can be added into the target data table in several different ways:
- Propagate All will insert all source columns into the target data table, whether they already existed or not.
- Propagate Selected will insert selected source column(s) only.
- Right click on target side and select Insert Row to insert a row immediately above the currently selected row.
- Right click on target side and select Append Row to insert a row at the bottom (far right) of the target data table.
Deleting Columns
To delete columns from the target data table, select the desired column(s), then right click and select Delete.
Changing Column Order
To rearrange columns in the target data table, select the desired column(s). You can use either:
- Bulk Move Arrows: Select the desired move option from the arrows in the upper right
- Context Menu: Right clikc and select Move to Top, Move Up, Move Down, or Move to Bottom.
Reduce Result to Distinct Records Only
To return only distinct options, select the Distinct menu option. This will toggle a set of checkboxes for each column in the source. Simply check any box next to the corresponding column to return only distinct results.
Depending on the situation, you may want to consider use of Summarization instead.
The distinct process retains the first unique record found and discards the rest. You may want to apply a sort on the data if it is important for consistency between runs.
Aggregation and Grouping
To aggregate results, select the Summarize menu option. This will toggle a set of select boxes for each column in the target data table. Choose an appropriate summarization method for each column.
- Group By
- Sum
- Min
- Max
- First
- Last
- Count
- Count (including nulls)
- Mean
- Standard Deviation
- Sample Standard Deviation
- Population Standard Deviation
- Variance
- Sample Variance
- Population Variance
- Advanced Non-Group_By
For advanced data mapper usage such as expressions, cleaning, and constants, please see the Advanced Data Mapper Usage
For more aggregation details, see the Analyze overview page here.
Data Filters
To allow for maximum flexibility, data filters are available on the source data and the target data. For larger data sets, it can be especially beneficial to filter out rows on the source so the remaining operations are performed on a smaller data set.
Select Subset Of Data
This filter type provides a way to filter the inbound source data based on the specified conditions.
Apply Secondary Filter To Result Data
This filter type provides a way to apply a filter to the post-transformed result data based on the specified conditions. The ability to apply a filter on the post-transformed result allows for exclusions based on results of complex calcuations, summarizaitons, or window functions.
Final Data Table Slicing (Limit)
The row slicing capability provides the ability to limit the rows in the result set based on a range and starting point.
Filter Syntax
The filter syntax utilizes Python SQLAlchemy which is the same syntax as other expressions.
View examples and expression functions in the Expressions area.
Examples
No examples yet...
3 - Export to External Project Table
Description
Export data from a project table to different project's table.
Data Sharing Management
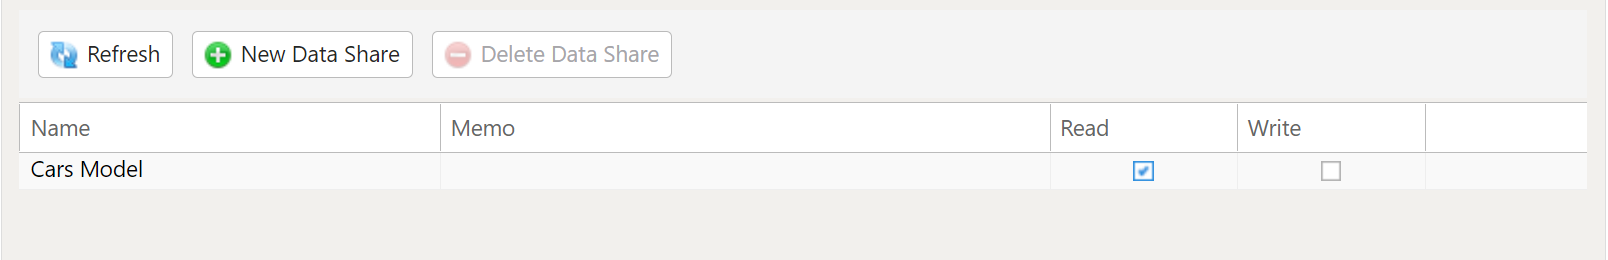
In order to export a table to another project you must first go to both projects Home Tab and allow the projects to share data with each other. To do this select New Data Share and select the project and give them Read access.
Export External Project Table
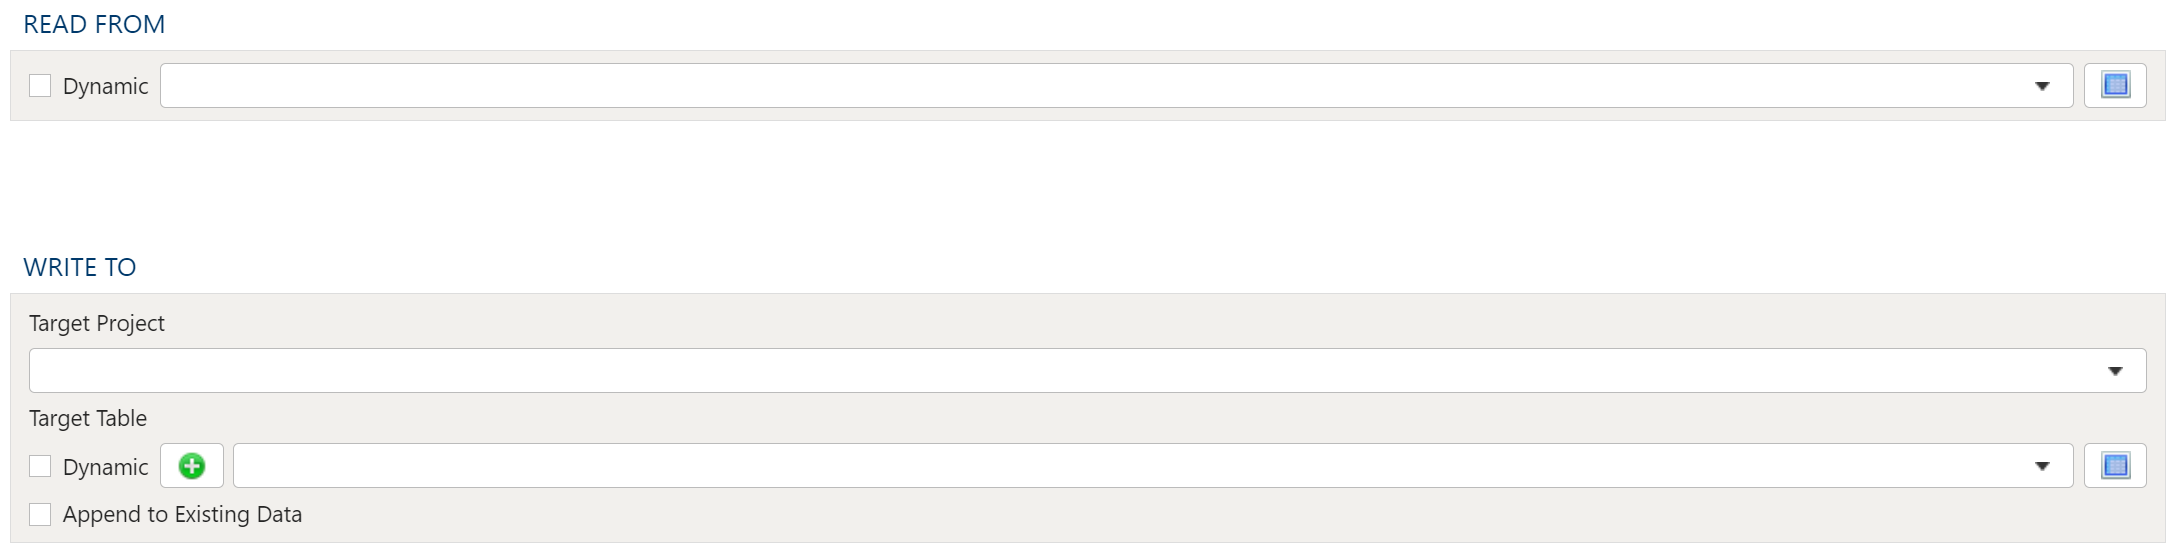
Read From
Select the Source Table from the drop down menu.
Write To
Target Project
Select the Target Project from the drop down menu.
Target Table Static
To establish the target table select either an existing table as the target table using the Target Table dropdown or click on the green "+" sign to create a new table as the target.
Table Creation
When creating a new table you will have the option to either create it as a View or as a Table.
Views:
Views are useful in that the time required for a step to execute is significantly less than when a table is used. The downside of views is they are not a useful for data exploration in the table Details mode.
Tables:
When using a table as the target a step will take longer to execute but data exploration in the Details mode is much quicker than with a view.
Target Table Dynamic
The Dynamic option allows specification of a table using text, including variables. This is useful when employing variable driven workflows where table and view references are relative to the variables specified.
An example that uses the current_month variable to dynamically point to target table:
legal_entity/inputs/{current_month}/ledger_values
Append to Existing Data
To append the data from the source table to the target table select the Append to Existing Data check box.
4 - Export to Google Spreadsheet
Description
Export an Analyze data table to Google Drive as a Google Spreadsheet. A valid Google account is required to use this transform. User credentials must be set up in PlaidCloud Tools prior to using the transform.
Export Parameters
Source and Target
Select the Source Table from PlaidCloud Document using the dropdown menu.
Next, specify the Target Connection information. For details on setting up a Google Docs account connection, see here: PlaidCloud Tools – Connection. Once all necessary accounts have been set up, select the appropriate account from the dropdown list.
Finally, provide the Target Spreadsheet Name and Target Worksheet Name. If desired, select the Append data to existing Worksheet data checkbox to append data to an existing Worksheet. If the target worksheet does not yet exist, it will be created.
Table Data Selection
Data Mapper Configuration
The Data Mapper is used to map columns from the source data to the target data table.
Inspection and Populating the Mapper
Using the Inspect Source menu button provides additional ways to map columns from source to target:
- Populate Both Mapping Tables: Propagates all values from the source data table into the target data table. This is done by default.
- Populate Source Mapping Table Only: Maps all values in the source data table only. This is helpful when modifying an existing workflow when source column structure has changed.
- Populate Target Mapping Table Only: Propagates all values into the target data table only.
If the source and target column options aren’t enough, other columns can be added into the target data table in several different ways:
- Propagate All will insert all source columns into the target data table, whether they already existed or not.
- Propagate Selected will insert selected source column(s) only.
- Right click on target side and select Insert Row to insert a row immediately above the currently selected row.
- Right click on target side and select Append Row to insert a row at the bottom (far right) of the target data table.
Deleting Columns
To delete columns from the target data table, select the desired column(s), then right click and select Delete.
Changing Column Order
To rearrange columns in the target data table, select the desired column(s). You can use either:
- Bulk Move Arrows: Select the desired move option from the arrows in the upper right
- Context Menu: Right clikc and select Move to Top, Move Up, Move Down, or Move to Bottom.
Reduce Result to Distinct Records Only
To return only distinct options, select the Distinct menu option. This will toggle a set of checkboxes for each column in the source. Simply check any box next to the corresponding column to return only distinct results.
Depending on the situation, you may want to consider use of Summarization instead.
The distinct process retains the first unique record found and discards the rest. You may want to apply a sort on the data if it is important for consistency between runs.
Aggregation and Grouping
To aggregate results, select the Summarize menu option. This will toggle a set of select boxes for each column in the target data table. Choose an appropriate summarization method for each column.
- Group By
- Sum
- Min
- Max
- First
- Last
- Count
- Count (including nulls)
- Mean
- Standard Deviation
- Sample Standard Deviation
- Population Standard Deviation
- Variance
- Sample Variance
- Population Variance
- Advanced Non-Group_By
For advanced data mapper usage such as expressions, cleaning, and constants, please see the Advanced Data Mapper Usage
For more aggregation details, see the Analyze overview page here.
Data Filters
To allow for maximum flexibility, data filters are available on the source data and the target data. For larger data sets, it can be especially beneficial to filter out rows on the source so the remaining operations are performed on a smaller data set.
Select Subset Of Data
This filter type provides a way to filter the inbound source data based on the specified conditions.
Apply Secondary Filter To Result Data
This filter type provides a way to apply a filter to the post-transformed result data based on the specified conditions. The ability to apply a filter on the post-transformed result allows for exclusions based on results of complex calcuations, summarizaitons, or window functions.
Final Data Table Slicing (Limit)
The row slicing capability provides the ability to limit the rows in the result set based on a range and starting point.
Filter Syntax
The filter syntax utilizes Python SQLAlchemy which is the same syntax as other expressions.
View examples and expression functions in the Expressions area.
Examples
No examples yet...
5 - Export to HDF
Description
Export an Analyze data table to PlaidCloud Document as an HDF5 file.
For more details on HDF5 files, see the HDF Group’s official website here: http://www.hdfgroup.org/HDF5/.
Export Parameters
Export File Selector
The file selector in this transform allows you to choose a destination store the exported result in a PlaidCloud Document.
You choose a directory and specify a file name for the target file.
Source Table
Dynamic Option
The Dynamic option allows specification of a table using text, including variables. This is useful when employing variable driven workflows where table and view references are relative to the variables specified.
An example that uses the current_month variable to dynamically point to source table:
legal_entity/inputs/{current_month}/ledger_values
Static Option
When a specific table is desired as the source for the export, leave the Dynamic box unchecked and select the source table.
Table Explorer is always avaible with any table selection. Click on the Table Explorer button to the right of the table selection and a Table Explorer window will open.
Selecting a Document Account
Choose a PlaidCloud Document account for which you have access. This will provide you with the ability to select a directory next selection.
Target Directory Path
Select the Browse icon to the right of the Target Directory Path and navigate to the location you want the file saved to.
Target File Name
Specify the name the exported file should be saved as.
Output File Type
All exported files are uncompressed, but the following compression options are available:
- Zip
- GZip
- BZip2
Table Data Selection
Data Mapper Configuration
The Data Mapper is used to map columns from the source data to the target data table.
Inspection and Populating the Mapper
Using the Inspect Source menu button provides additional ways to map columns from source to target:
- Populate Both Mapping Tables: Propagates all values from the source data table into the target data table. This is done by default.
- Populate Source Mapping Table Only: Maps all values in the source data table only. This is helpful when modifying an existing workflow when source column structure has changed.
- Populate Target Mapping Table Only: Propagates all values into the target data table only.
If the source and target column options aren’t enough, other columns can be added into the target data table in several different ways:
- Propagate All will insert all source columns into the target data table, whether they already existed or not.
- Propagate Selected will insert selected source column(s) only.
- Right click on target side and select Insert Row to insert a row immediately above the currently selected row.
- Right click on target side and select Append Row to insert a row at the bottom (far right) of the target data table.
Deleting Columns
To delete columns from the target data table, select the desired column(s), then right click and select Delete.
Changing Column Order
To rearrange columns in the target data table, select the desired column(s). You can use either:
- Bulk Move Arrows: Select the desired move option from the arrows in the upper right
- Context Menu: Right clikc and select Move to Top, Move Up, Move Down, or Move to Bottom.
Reduce Result to Distinct Records Only
To return only distinct options, select the Distinct menu option. This will toggle a set of checkboxes for each column in the source. Simply check any box next to the corresponding column to return only distinct results.
Depending on the situation, you may want to consider use of Summarization instead.
The distinct process retains the first unique record found and discards the rest. You may want to apply a sort on the data if it is important for consistency between runs.
Aggregation and Grouping
To aggregate results, select the Summarize menu option. This will toggle a set of select boxes for each column in the target data table. Choose an appropriate summarization method for each column.
- Group By
- Sum
- Min
- Max
- First
- Last
- Count
- Count (including nulls)
- Mean
- Standard Deviation
- Sample Standard Deviation
- Population Standard Deviation
- Variance
- Sample Variance
- Population Variance
- Advanced Non-Group_By
For advanced data mapper usage such as expressions, cleaning, and constants, please see the Advanced Data Mapper Usage
For more aggregation details, see the Analyze overview page here.
Data Filters
To allow for maximum flexibility, data filters are available on the source data and the target data. For larger data sets, it can be especially beneficial to filter out rows on the source so the remaining operations are performed on a smaller data set.
Select Subset Of Data
This filter type provides a way to filter the inbound source data based on the specified conditions.
Apply Secondary Filter To Result Data
This filter type provides a way to apply a filter to the post-transformed result data based on the specified conditions. The ability to apply a filter on the post-transformed result allows for exclusions based on results of complex calcuations, summarizaitons, or window functions.
Final Data Table Slicing (Limit)
The row slicing capability provides the ability to limit the rows in the result set based on a range and starting point.
Filter Syntax
The filter syntax utilizes Python SQLAlchemy which is the same syntax as other expressions.
View examples and expression functions in the Expressions area.
Examples
No examples yet...
6 - Export to HTML
Description
Export an Analyze data table to PlaidCloud Document as an HTML file. The resultant HTML file will simply contain a table.
Export Parameters
Export File Selector
The file selector in this transform allows you to choose a destination store the exported result in a PlaidCloud Document.
You choose a directory and specify a file name for the target file.
Source Table
Dynamic Option
The Dynamic option allows specification of a table using text, including variables. This is useful when employing variable driven workflows where table and view references are relative to the variables specified.
An example that uses the current_month variable to dynamically point to source table:
legal_entity/inputs/{current_month}/ledger_values
Static Option
When a specific table is desired as the source for the export, leave the Dynamic box unchecked and select the source table.
Table Explorer is always avaible with any table selection. Click on the Table Explorer button to the right of the table selection and a Table Explorer window will open.
Selecting a Document Account
Choose a PlaidCloud Document account for which you have access. This will provide you with the ability to select a directory next selection.
Target Directory Path
Select the Browse icon to the right of the Target Directory Path and navigate to the location you want the file saved to.
Target File Name
Specify the name the exported file should be saved as.

Bold Rows
Select this checkbox to make the first row (header row) bold font.
Escape
This option is enabled by default. When the checkbox is selected, the export process will convert the characters <, >, and & to HTML-safe sequences.
Double Precision
See details here:
Output File Type
All exported files are uncompressed, but the following compression options are available:
- Zip
- GZip
- BZip2
Table Data Selection
Data Mapper Configuration
The Data Mapper is used to map columns from the source data to the target data table.
Inspection and Populating the Mapper
Using the Inspect Source menu button provides additional ways to map columns from source to target:
- Populate Both Mapping Tables: Propagates all values from the source data table into the target data table. This is done by default.
- Populate Source Mapping Table Only: Maps all values in the source data table only. This is helpful when modifying an existing workflow when source column structure has changed.
- Populate Target Mapping Table Only: Propagates all values into the target data table only.
If the source and target column options aren’t enough, other columns can be added into the target data table in several different ways:
- Propagate All will insert all source columns into the target data table, whether they already existed or not.
- Propagate Selected will insert selected source column(s) only.
- Right click on target side and select Insert Row to insert a row immediately above the currently selected row.
- Right click on target side and select Append Row to insert a row at the bottom (far right) of the target data table.
Deleting Columns
To delete columns from the target data table, select the desired column(s), then right click and select Delete.
Changing Column Order
To rearrange columns in the target data table, select the desired column(s). You can use either:
- Bulk Move Arrows: Select the desired move option from the arrows in the upper right
- Context Menu: Right clikc and select Move to Top, Move Up, Move Down, or Move to Bottom.
Reduce Result to Distinct Records Only
To return only distinct options, select the Distinct menu option. This will toggle a set of checkboxes for each column in the source. Simply check any box next to the corresponding column to return only distinct results.
Depending on the situation, you may want to consider use of Summarization instead.
The distinct process retains the first unique record found and discards the rest. You may want to apply a sort on the data if it is important for consistency between runs.
Aggregation and Grouping
To aggregate results, select the Summarize menu option. This will toggle a set of select boxes for each column in the target data table. Choose an appropriate summarization method for each column.
- Group By
- Sum
- Min
- Max
- First
- Last
- Count
- Count (including nulls)
- Mean
- Standard Deviation
- Sample Standard Deviation
- Population Standard Deviation
- Variance
- Sample Variance
- Population Variance
- Advanced Non-Group_By
For advanced data mapper usage such as expressions, cleaning, and constants, please see the Advanced Data Mapper Usage
For more aggregation details, see the Analyze overview page here.
Data Filters
To allow for maximum flexibility, data filters are available on the source data and the target data. For larger data sets, it can be especially beneficial to filter out rows on the source so the remaining operations are performed on a smaller data set.
Select Subset Of Data
This filter type provides a way to filter the inbound source data based on the specified conditions.
Apply Secondary Filter To Result Data
This filter type provides a way to apply a filter to the post-transformed result data based on the specified conditions. The ability to apply a filter on the post-transformed result allows for exclusions based on results of complex calcuations, summarizaitons, or window functions.
Final Data Table Slicing (Limit)
The row slicing capability provides the ability to limit the rows in the result set based on a range and starting point.
Filter Syntax
The filter syntax utilizes Python SQLAlchemy which is the same syntax as other expressions.
View examples and expression functions in the Expressions area.
Examples
No examples yet...
7 - Export to JSON
Description
Export an Analyze data table to PlaidCloud Document as a JSON file. There are several options (shown below) for data orientation.
For more details on JSON files, see the JSON official website here: http://json.org/.
Export Parameters
Export File Selector
The file selector in this transform allows you to choose a destination store the exported result in a PlaidCloud Document.
You choose a directory and specify a file name for the target file.
Source Table
Dynamic Option
The Dynamic option allows specification of a table using text, including variables. This is useful when employing variable driven workflows where table and view references are relative to the variables specified.
An example that uses the current_month variable to dynamically point to source table:
legal_entity/inputs/{current_month}/ledger_values
Static Option
When a specific table is desired as the source for the export, leave the Dynamic box unchecked and select the source table.
Table Explorer is always avaible with any table selection. Click on the Table Explorer button to the right of the table selection and a Table Explorer window will open.
Selecting a Document Account
Choose a PlaidCloud Document account for which you have access. This will provide you with the ability to select a directory next selection.
Target Directory Path
Select the Browse icon to the right of the Target Directory Path and navigate to the location you want the file saved to.
Target File Name
Specify the name the exported file should be saved as.
JSON Orientation
Consider the following data set:
| ID | Name | Gender | State |
|---|---|---|---|
| 1 | Jack | M | MO |
| 2 | Jill | F | MO |
| 3 | George | M | VA |
| 4 | Abe | M | KY |
JSON files can be exported into one of four data formats:
- Records: Data is stored in Python dictionary sets, with each row stored in {Column -> Value, …} format. For example: [{“ID”:1,”Name”:”Jack”,”Gender”:”M”,”State”:”MO”},{“ID”:2,”Name”:”Jill”,”Gender”:”F”,”State”:”MO”},{“ID”:3,”Name”:”George”,”Gender”:”M”,”State”:”VA”},{“ID”:4,”Name”:”Abe”,”Gender”:”M”,”State”:”KY”}]
- Index: Data is stored in nested Python dictionary sets, with each row stored in {Index -> {Column -> Value, …},…} format. For example: {“0”:{“ID”:1,”Name”:”Jack”,”Gender”:”M”,”State”:”MO”},”1”:{“ID”:2,”Name”:”Jill”,”Gender”:”F”,”State”:”MO”},”2”:{“ID”:3,”Name”:”George”,”Gender”:”M”,”State”:”VA”},”3”:{“ID”:4,”Name”:”Abe”,”Gender”:”M”,”State”:”KY”}}
- Split: Data is stored in a single Python dictionary set, values are stored in lists. For example: {“columns”:[“ID”,”Name”,”Gender”,”State”],”index”:[0,1,2,3],”data”:[[1,”Jack”,”M”,”MO”],[2,”Jill”,”F”,”MO”],[3,”George”,”M”,”VA”],[4,”Abe”,”M”,”KY”]]}
- Values: Data is stored in multiple Python lists. For example: [[1,”Jack”,”M”,”MO”],[2,”Jill”,”F”,”MO”],[3,”George”,”M”,”VA”],[4,”Abe”,”M”,”KY”]]
Date Handling
Specify Date Format using the dropdown menu. Choose from the following formats:
- Epoch (Unix Timestamp – Seconds since 1/1/1970)
- ISO 8601 Format (YYYY-MM-DD HH:MM:SS with timeproject offset)
Specify Date Unit using the dropdown menu. Choose from the following formats, listed in order of increasing precision:
- Seconds (s)
- Milliseconds (ms)
- Microseconds (us)
- Nanoseconds (ns)
Force ASCII
Select this checkbox to ensure that all strings are encoded in proper ASCII format. This is enabled by default.
Output File Type
All exported files are uncompressed, but the following compression options are available:
- Zip
- GZip
- BZip2
Table Data Selection
Data Mapper Configuration
The Data Mapper is used to map columns from the source data to the target data table.
Inspection and Populating the Mapper
Using the Inspect Source menu button provides additional ways to map columns from source to target:
- Populate Both Mapping Tables: Propagates all values from the source data table into the target data table. This is done by default.
- Populate Source Mapping Table Only: Maps all values in the source data table only. This is helpful when modifying an existing workflow when source column structure has changed.
- Populate Target Mapping Table Only: Propagates all values into the target data table only.
If the source and target column options aren’t enough, other columns can be added into the target data table in several different ways:
- Propagate All will insert all source columns into the target data table, whether they already existed or not.
- Propagate Selected will insert selected source column(s) only.
- Right click on target side and select Insert Row to insert a row immediately above the currently selected row.
- Right click on target side and select Append Row to insert a row at the bottom (far right) of the target data table.
Deleting Columns
To delete columns from the target data table, select the desired column(s), then right click and select Delete.
Changing Column Order
To rearrange columns in the target data table, select the desired column(s). You can use either:
- Bulk Move Arrows: Select the desired move option from the arrows in the upper right
- Context Menu: Right clikc and select Move to Top, Move Up, Move Down, or Move to Bottom.
Reduce Result to Distinct Records Only
To return only distinct options, select the Distinct menu option. This will toggle a set of checkboxes for each column in the source. Simply check any box next to the corresponding column to return only distinct results.
Depending on the situation, you may want to consider use of Summarization instead.
The distinct process retains the first unique record found and discards the rest. You may want to apply a sort on the data if it is important for consistency between runs.
Aggregation and Grouping
To aggregate results, select the Summarize menu option. This will toggle a set of select boxes for each column in the target data table. Choose an appropriate summarization method for each column.
- Group By
- Sum
- Min
- Max
- First
- Last
- Count
- Count (including nulls)
- Mean
- Standard Deviation
- Sample Standard Deviation
- Population Standard Deviation
- Variance
- Sample Variance
- Population Variance
- Advanced Non-Group_By
For advanced data mapper usage such as expressions, cleaning, and constants, please see the Advanced Data Mapper Usage
For more aggregation details, see the Analyze overview page here.
Data Filters
To allow for maximum flexibility, data filters are available on the source data and the target data. For larger data sets, it can be especially beneficial to filter out rows on the source so the remaining operations are performed on a smaller data set.
Select Subset Of Data
This filter type provides a way to filter the inbound source data based on the specified conditions.
Apply Secondary Filter To Result Data
This filter type provides a way to apply a filter to the post-transformed result data based on the specified conditions. The ability to apply a filter on the post-transformed result allows for exclusions based on results of complex calcuations, summarizaitons, or window functions.
Final Data Table Slicing (Limit)
The row slicing capability provides the ability to limit the rows in the result set based on a range and starting point.
Filter Syntax
The filter syntax utilizes Python SQLAlchemy which is the same syntax as other expressions.
View examples and expression functions in the Expressions area.
Examples
No examples yet...
8 - Export to Quandl
Description
Export an Analyze data table to Quandl’s database.
Source and Target
Specify the following parameters:
- Source Table: Analyze data table to export
- Quandl Connection: Accessing Quandl data sets requires a user account or a guest account with limited access. This requires set up in Tools. For details on setting up a Quandl account connection, see here: PlaidCloud Tools – Connection
- Quandl Code: Use the Search button to search for data sets. Alternatively, data sets can be entered manually. This requires the user to enter the portion of the URL after “http://www.quandl.com”. For example, to import the data set for Microsoft stock, which can be found here (http://www.quandl.com/GOOG/NASDAQ_MSFT), enter GOOG/NASDAQ_MSFT in the Quandl Code field
- Dataset Name: Name of the dataset to be exported to Quandl
- Dataset Description: Description of dataset to be exported to Quandl
Table Data Selection
Data Mapper Configuration
The Data Mapper is used to map columns from the source data to the target data table.
Inspection and Populating the Mapper
Using the Inspect Source menu button provides additional ways to map columns from source to target:
- Populate Both Mapping Tables: Propagates all values from the source data table into the target data table. This is done by default.
- Populate Source Mapping Table Only: Maps all values in the source data table only. This is helpful when modifying an existing workflow when source column structure has changed.
- Populate Target Mapping Table Only: Propagates all values into the target data table only.
If the source and target column options aren’t enough, other columns can be added into the target data table in several different ways:
- Propagate All will insert all source columns into the target data table, whether they already existed or not.
- Propagate Selected will insert selected source column(s) only.
- Right click on target side and select Insert Row to insert a row immediately above the currently selected row.
- Right click on target side and select Append Row to insert a row at the bottom (far right) of the target data table.
Deleting Columns
To delete columns from the target data table, select the desired column(s), then right click and select Delete.
Changing Column Order
To rearrange columns in the target data table, select the desired column(s). You can use either:
- Bulk Move Arrows: Select the desired move option from the arrows in the upper right
- Context Menu: Right clikc and select Move to Top, Move Up, Move Down, or Move to Bottom.
Reduce Result to Distinct Records Only
To return only distinct options, select the Distinct menu option. This will toggle a set of checkboxes for each column in the source. Simply check any box next to the corresponding column to return only distinct results.
Depending on the situation, you may want to consider use of Summarization instead.
The distinct process retains the first unique record found and discards the rest. You may want to apply a sort on the data if it is important for consistency between runs.
Aggregation and Grouping
To aggregate results, select the Summarize menu option. This will toggle a set of select boxes for each column in the target data table. Choose an appropriate summarization method for each column.
- Group By
- Sum
- Min
- Max
- First
- Last
- Count
- Count (including nulls)
- Mean
- Standard Deviation
- Sample Standard Deviation
- Population Standard Deviation
- Variance
- Sample Variance
- Population Variance
- Advanced Non-Group_By
For advanced data mapper usage such as expressions, cleaning, and constants, please see the Advanced Data Mapper Usage
For more aggregation details, see the Analyze overview page here.
Data Filters
To allow for maximum flexibility, data filters are available on the source data and the target data. For larger data sets, it can be especially beneficial to filter out rows on the source so the remaining operations are performed on a smaller data set.
Select Subset Of Data
This filter type provides a way to filter the inbound source data based on the specified conditions.
Apply Secondary Filter To Result Data
This filter type provides a way to apply a filter to the post-transformed result data based on the specified conditions. The ability to apply a filter on the post-transformed result allows for exclusions based on results of complex calcuations, summarizaitons, or window functions.
Final Data Table Slicing (Limit)
The row slicing capability provides the ability to limit the rows in the result set based on a range and starting point.
Filter Syntax
The filter syntax utilizes Python SQLAlchemy which is the same syntax as other expressions.
View examples and expression functions in the Expressions area.
Examples
No examples yet...
9 - Export to SQL
Description
Export an Analyze data table to PlaidCloud Document as an SQL.
Examples
No examples yet...
10 - Export to Table Archive
Description
Exports PlaidCloud table archive file.
Export Parameters
Export File Selector
The file selector in this transform allows you to choose a destination store the exported result in a PlaidCloud Document.
You choose a directory and specify a file name for the target file.
Source Table
Dynamic Option
The Dynamic option allows specification of a table using text, including variables. This is useful when employing variable driven workflows where table and view references are relative to the variables specified.
An example that uses the current_month variable to dynamically point to source table:
legal_entity/inputs/{current_month}/ledger_values
Static Option
When a specific table is desired as the source for the export, leave the Dynamic box unchecked and select the source table.
Table Explorer is always avaible with any table selection. Click on the Table Explorer button to the right of the table selection and a Table Explorer window will open.
Selecting a Document Account
Choose a PlaidCloud Document account for which you have access. This will provide you with the ability to select a directory next selection.
Target Directory Path
Select the Browse icon to the right of the Target Directory Path and navigate to the location you want the file saved to.
Target File Name
Specify the name the exported file should be saved as.
Examples
No examples yet...
11 - Export to XML
Description
Export an Analyze data table to PlaidCloud Document as an XML file.