This is the multi-page printable view of this section. Click here to print.
Analyze
- 1: Projects
- 1.1: Viewing Projects
- 1.2: Managing Projects
- 1.3: Managing Tables and Views
- 1.4: Managing Hierarchies
- 1.5: Managing Data Editors
- 1.6: Archive a Project
- 1.7: Viewing the Project Log
- 2: Data Management
- 2.1: Using Tables and Views
- 2.2: Table Explorer
- 2.3: Using Dimensions (Hierarchies)
- 2.4: Publishing Tables
- 3: Workflows
- 3.1: Where are the Workflows
- 3.2: Workflow Explorer
- 3.3: Create Workflow
- 3.4: Duplicate a Workflow
- 3.5: Copy & Paste steps
- 3.6: Change the order of steps in a workflow
- 3.7: Run a workflow
- 3.8: Running one step in a workflow
- 3.9: Running a range of steps in a workflow
- 3.10: Managing Step Errors
- 3.11: Continue on Error
- 3.12: Skip steps in a workflow
- 3.13: Conditional Step Execution
- 3.14: Controlling Parallel Execution
- 3.15: Manage Workflow Variables
- 3.16: Viewing Workflow Log
- 3.17: View Workflow Report
- 3.18: View a dependency audit
- 4: Workflow Steps
- 4.1: Workflow Control Steps
- 4.1.1: Create Workflow
- 4.1.2: Run Workflow
- 4.1.3: Stop Workflow
- 4.1.4: Copy Workflow
- 4.1.5: Rename Workflow
- 4.1.6: Delete Workflow
- 4.1.7: Set Project Variable
- 4.1.8: Set Workflow Variable
- 4.1.9: Worklow Loop
- 4.1.10: Raise Workflow Error
- 4.1.11: Clear Workflow Log
- 4.2: Import Steps
- 4.2.1: Import Archive
- 4.2.2: Import CSV
- 4.2.3: Import Excel
- 4.2.4: Import External Database Tables
- 4.2.5: Import Fixed Width
- 4.2.6: Import Google BigQuery
- 4.2.7: Import Google Spreadsheet
- 4.2.8: Import HDF
- 4.2.9: Import HTML
- 4.2.10: Import JSON
- 4.2.11: Import Project Table
- 4.2.12: Import Quandl
- 4.2.13: Import SAS7BDAT
- 4.2.14: Import SPSS
- 4.2.15: Import SQL
- 4.2.16: Import Stata
- 4.2.17: Import XML
- 4.3: Export Steps
- 4.3.1: Export to CSV
- 4.3.2: Export to Excel
- 4.3.3: Export to External Project Table
- 4.3.4: Export to Google Spreadsheet
- 4.3.5: Export to HDF
- 4.3.6: Export to HTML
- 4.3.7: Export to JSON
- 4.3.8: Export to Quandl
- 4.3.9: Export to SQL
- 4.3.10: Export to Table Archive
- 4.3.11: Export to XML
- 4.4: Table Steps
- 4.4.1: Table Anti Join
- 4.4.2: Table Append
- 4.4.3: Table Clear
- 4.4.4: Table Copy
- 4.4.5: Table Cross Join
- 4.4.6: Table Drop
- 4.4.7: Table Extract
- 4.4.8: Table Faker
- 4.4.9: Table In-Place Delete
- 4.4.10: Table In-Place Update
- 4.4.11: Table Inner Join
- 4.4.12: Table Lookup
- 4.4.13: Table Melt
- 4.4.14: Table Outer Join
- 4.4.15: Table Pivot
- 4.4.16: Table Union All
- 4.4.17: Table Union Distinct
- 4.4.18: Table Upsert
- 4.5: Dimension Steps
- 4.5.1: Dimension Clear
- 4.5.2: Dimension Create
- 4.5.3: Dimension Delete
- 4.5.4: Dimension Load
- 4.5.5: Dimension Sort
- 4.6: Document Steps
- 4.6.1: Compress PDF
- 4.6.2: Concatenate Files
- 4.6.3: Convert Document Encoding
- 4.6.4: Convert Document Encoding to ASCII
- 4.6.5: Convert Document Encoding to UTF-8
- 4.6.6: Convert Document Encoding to UTF-16
- 4.6.7: Convert Image to PDF
- 4.6.8: Convert PDF or Image to JPEG
- 4.6.9: Copy Document Directory
- 4.6.10: Copy Document File
- 4.6.11: Create Document Directory
- 4.6.12: Crop Image to Headshot
- 4.6.13: Delete Document Directory
- 4.6.14: Delete Document File
- 4.6.15: Document Text Substitution
- 4.6.16: Fix File Extension
- 4.6.17: Merge Multiple PDFs
- 4.6.18: Rename Document Directory
- 4.6.19: Rename Document File
- 4.7: Notification Steps
- 4.7.1: Notify Distribution Group
- 4.7.2: Notify Agent
- 4.7.3: Notify Via Email
- 4.7.4: Notify Via Log
- 4.7.5: Notify via Microsoft Teams
- 4.7.6: Notify via Slack
- 4.7.7: Notify Via SMS
- 4.7.8: Notify Via Twitter
- 4.7.9: Notify Via Web Hook
- 4.8: Agent Steps
- 4.8.1: Agent Remote Execution of SQL
- 4.8.2: Agent Remote Export of SQL Result
- 4.8.3: Agent Remote Import Table into SQL Database
- 4.8.4: Document - Remote Delete File
- 4.8.5: Document - Remote Export File
- 4.8.6: Document - Remote Import File
- 4.8.7: Document - Remote Rename File
- 4.9: General Steps
- 4.9.1: Pass
- 4.9.2: Run Remote Python
- 4.9.3: User Defined Transform
- 4.9.4: Wait
- 4.10: PDF Reporting Steps
- 4.10.1: Report Single
- 4.10.2: Reports Batch
- 4.11: Common Step Operations
- 4.11.1: Advanced Data Mapper Usage
- 4.12: Allocation By Assignment Dimension
- 4.13: Allocation Split
- 4.14: Rule-Based Tagging
- 4.15: SAP ECC and S/4HANA Steps
- 4.15.1: Call SAP Financial Document Attachment
- 4.15.2: Call SAP General Ledger Posting
- 4.15.3: Call SAP Master Data Table RFC
- 4.15.4: Call SAP RFC
- 4.16: SAP PCM Steps
- 4.16.1: Create SAP PCM Model
- 4.16.2: Delete SAP PCM Model
- 4.16.3: Calculate PCM Model
- 4.16.4: Copy SAP PCM Model
- 4.16.5: Copy SAP PCM Period
- 4.16.6: Copy SAP PCM Version
- 4.16.7: Rename SAP PCM Model
- 4.16.8: Run SAP PCM Console Job
- 4.16.9: Run SAP PCM Hyper Loader
- 4.16.10: Stop PCM Model Calculation
- 5: Scheduled Workflows
- 5.1: Event Scheduler
- 6: External Data Source and Service Connectors
- 6.1: Data Connections
- 7: Allocation Assignments
- 7.1: Getting Started
- 7.1.1: Allocations Quick Start
- 7.1.2: Why are Allocations Useful
- 7.2: Configure Allocations
- 7.2.1: Configure an Allocation
- 7.2.2: Recursive Allocations
- 7.3: Results and Troubleshooting
- 7.3.1: Allocation Results
- 7.3.2: Troubleshooting Allocations
- 8: Data Warehouse Service
- 8.1: Getting Started
- 8.2: Pricing
- 8.3: Greenplum Technical Resource Links
1 - Projects
1.1 - Viewing Projects
Description
Within Analyze, the Projects function provides a level of compartmentalization that makes controlling access and modifying privileges much easier. Projects are what provide the primary segregation of data within a workspace tab.
While Projects fall under Analyze, workflows fall under Projects, meaning that Projects contain workflows. Workflows, simply put, perform a wide range of tasks including data transformation pipelines, data analysis, and even ETL processes. More information on workflows can be found under the “Workflows” section.
Accessing Projects
To access Projects:
- Open Analyze
- Select “Projects” from the top menu bar
This displays the Projects Hierarchy. From here, you will see a hierarchy of projects for which you have access. There may be additional projects within the workspace, but, if you are not an owner or assigned to the project, they will not be visible to you.
1.2 - Managing Projects
Searching
Searching for projects is accomplished by using the filter box in the lower left of the hierarchy. The search filter will search project names and labels for matches and show the results in the hierarchy above.
Creating New Projects
To create a new project:
- Open Analyze
- Select “Projects” from the top menu bar
- Click the “New Project” button
- Complete the form information including the “Access Control” section
- Click “Create”
The project is now ready for updating access permissions, adding owners, and creating workflows.
Automatic Change Tracking
All changes to a project, including workflows, data editors, hierarchies, table structures, and UDFs are tracked and allow point-in-time recovery of the state. This allows for easy recovery from user introduced problems or simply copying a different point-in-time to another project for comparison.
In addition to overall tracking, projects and their elements also allow for versioning. Not only is creating a version easy, you can also merge changes from one version to another. This provides a simple way to keep track of snapshots or to create a version for development and then be able to merge those changes into the non-development version when you want.
Managing Project Access
Types of Access
Project security has been simplified into three types of access:
- All Workspace Members
- Specific Members Only
- Specific Security Groups Only
Setting the project security is easy to do:
- Open Analyze
- Select “Projects”
- Click the edit icon of the project you want to restrict
- Choose desired restriction under “Access Control”
- Click “Update”
All Workspace Members
“All Workspace Members” access is the most simple option since it provides access to all members of the workspace and does not require any additional assignment of members.
Specific Members Only
“The Specific Members Only” access setting requires assignment of each member to the project.To assign members to a project:
- Open Analyze
- Select “Projects” from the top menu bar
- Click the members icon
- Grant access to members by selecting the check box next to their name in the “Access” column
- Click “Update”
For clouds with large numbers of members, this approach can often require more effort than desired, which is where security groups become useful.
Specific Security Groups Only
The “Specific Security Groups Only” option enables assigning specific security groups permission to access the account. With access restrictions relying on association with a security group or groups, the administration of account access for larger groups is much simpler. This is particularly useful when combined with single sign-on automatic group association. By using single sign-on to set member group assignments, these groups can also enable and disable access to projects implicitly.
To edit assigned groups:
- Open Analyze
- Select “Projects” from the top menu bar
- Click the security groups icon
- Grant access to security groups by selecting the check box next to their name in the “Access” column
- Click “Update”
Setting Different Viewing Roles
Many times a project may require several transformations and tables to complete intermediate steps while the end result may end up only consisting of a few tables. Members do not always require viewing of all the elements of the project, sometimes just the final product. PlaidCloud offers you the ability to set different viewing roles to easily declutter and control the visibility of each member.
There are three built-in viewing roles: Architect, Manager, and Explorer
The Architect role is the most simple because it allows full visibility and control of projects, workflows, tables, variables, data editors, hierarchies, and user defined functions.
The Manager and Explorer roles have no specific access privileges but can be custom-defined. In other words, you can choose which items are visible to each group.
You can make everyone an Architect if you feel visibility of everything within the project is needed; otherwise, you can designate members as Manager and/or Explorer project members and control visibility that way.
To set the different role:
- Open Analyze
- Select “Projects”
- Click the members icon
- Select the member you whose role you would like to change
- Double click their current role in the “Role” column
- Select the desired role
- Click “Update”
Managing Project Variables
When running a project or workflow it may be useful to set variables for recurring tasks in order to decrease clutter and save time. These variables operate just like a normal algebraic variable by allowing you to set what the variable represents and what operation should follow it. PlaidCloud allows you to set these variables at the project level, which will effect all the workflows within that project, or at the workflow level, which will only effect that specific workflow.
To set a project level variable:
- Open Analyze
- Select “Projects”
- Click the Manage Project Variables icon
From the Variables Table you can view the variables and view/edit the current values. You can also add new or delete existing variables by clicking the “New Project Variable” button.
Cloning a Project
When a project is cloned, there may be project related references, such as workflow steps, that run within the project. PlaidCloud offers two options for performing a full duplication:
- Duplicate with updating project references
- Duplicate without updating project references
Duplicating with updating project references means all the related references point to the newly duplicated project.
To duplicate with updating project references:
- Open Analyze
- Select “Projects”
- Select the project you would like to duplicate
- Click the “Actions” button
- Select the “Duplicate with project reference updates” option
To duplicate without updating project references means to have all of the related references continue pointing to the original project.
To duplicate without updating project references:
- Open Analyze
- Select “Projects”
- Select the project you would like to duplicate
- Click the “Actions” button
- Select the “Duplicate without project reference updates” option
Viewing the Project Report
When a project or workflow is dynamic, maintaining detailed documentation becomes a challenge. To help solve this problem, PlaidCloud provides the ability to generate a project-level report that gives detailed documentation of workflows, workflow steps, user defined transforms, variables, and tables. This report is generated on-demand and reflects the current state of the project.
To download the report:
- Open Analyze
- Select “Projects”
- Click the report icon
1.3 - Managing Tables and Views
PlaidCloud offers the ability to organize and manage tables, including labels. Tables are available to all workflows within a project and have many tools and options.
In addition to tables, PlaidCloud also offers Views based on table data. Using Views allows for instant updates when underlying table changes occur, as well as saving data storage space.
Options include:
- The same table can exist on multiple paths in the hierarchy (alternate hierarchies)
- Tables are taggable for easier search and inclusion in PlaidCloud processes
- Tables can be versioned
- Tables can be published so they are available for Dashboard Visualizations
PlaidCloud uses a path-based system to organize tables, like you would use to navigate a series of folders, allowing for a more flexible and logical organization of tables. Using this system, tables can be moved within a hierarchy, or multiple references to one table from different locations in the hierarchy (alternate hierarchies), can be created. The ability to manage tables using this method allows the structure to reflect operational needs, reporting, and control.
Searching
Searching for tables is accomplished by using the filter box in the lower left of hierarchy. The search filter will search table names and labels for matches and show the results in the hierarchy above.
Move
To move a table:
- Drag it into the folder where you wish it to be located
Rename
To rename a table:
- Right click on the table
- Select the rename option
- Type in the new name and save it
- The table is now renamed, but it retains its original unique identifier.
Clear
To clear a table:
- Select the tables in the hierarchy ‘
- Click the clear button on the top toolbar.
Note: You can clear a single table or multiple tables
Delete
To delete a table:
- Select the tables in the hierarchy
- Click the delete button on the top toolbar
- The deleted operation will check to see if the table is in use by workflow steps or Views. If so, you will be asked to remove those associations before deletion can occur.
Note: You can also force delete the table(s). Force deletion of the table(s) will leave references broken, so this should be used sparingly.
Create New Directory Structure
To add a new folder:
- Click the New Folder button on the toolbar
To add a folder to an existing folder:
- Right-click on the folder
- Select New Folder
View Data (Table Explorer)
Table data is viewed using the Data Explorer. The Data Explorer provides a grid view of the data as well as a column by column summary of values and statistics. Point-and-click filtering and exporting to familiar file formats are both available. The filter selections can also be saved as an Extract step usable in a workflow.
Publish Table for Reporting
Dashboard Visualizations are purposely limited to tables that have been published. When publishing a table, you can provide a unique name that may distinguish the data. This may be useful when the table has a more obscure name on part of the workflow that generated it, but it needs a clearer name for those building dashboards.
Published tables do not have paths associated with them. They will appear as a list of tables for use in the dashboards area.
Mark Table for Viewing Roles
The viewing of tables by various roles can be controlled by clicking the Explorer or Manager checkboxes. If multiple tables need to be updated, select the tables in the hierarchy and select the desired viewing role from the Actions menu on the top toolbar.
Memos to Describe Table Contents
Add a memo to a table to help understand the data.
View Table Shape, Size, and Last Updated Time
The number of rows, columns, and the data size for each table is shown in the table hierarchy. For very large tables (multi-million rows) the row count may be estimated and an indicator for approximate row count will be shown.
View Additional Table Attributes
To view and edit other table attributes:
- Select a table
- Click the view the table context form on the right.
Duplicate a Table
To duplicate a table:
- Selecting the table
- Click on the duplicate button on the top toolbar.
1.4 - Managing Hierarchies
PlaidCloud offers the ability to organize and manage hierarchies, including labels. Hierarchies are available to all workflows within a project.
PlaidCloud uses a path-based system to organize hierarchies, like you would use to navigate a series of folders, allowing for a more flexible and logical organization (control hierarchy) of the hierarchies. Using this system, hierarchies can be moved within a control hierarchy, or multiple references to one hierarchy, from different locations in the control hierarchy (alternate hierarchies) can be created. The ability to manage hierarchies using this method allows the structure to reflect operational needs, reporting, and control.
Searching
To search for hierarchies:
- Use the filter box in the lower left of the control hierarchy
- The search filter will search hierarchy names and labels for matches and show the results in the control hierarchy above
Move
To move a hierarchy within the control hierarchy:
- Drag it into the folder where you wish to place it
Rename
To Rename a Hierarchy:
- Right click on the hierarchy
- Select the rename option
- Type in the new name and save it
- The hierarchy is now renamed, but it will retain its original unique identifier
Clear
You can clear a single hierarchy or multiple hierarchies.
To clear a hierarchy:
- Select the hierarchies in the control hierarchy
- Click the clear button on the top toolbar
Delete
You can delete a single hierarchy or multiple hierarchies.
To delete a hierarchy:
- Select the hierarchies in the control hierarchy
- Click the delete button on the top toolbar
The delete operation will check to see if the hierarchy is in use by workflow steps, tables, or views. If so, you will be asked to remove those associations.
Create New Directory Structure
To create a new folder:
- Clicking the New Folder button on the toolbar
To add a folder to an existing folder:
- Right-click on the folder
- Select New Folder.
Mark Hierarchy for Viewing Roles
To view hierarchies by roles:
- Click in the Explorer or Manager checkboxes
To view hierarchies that need to be updated:
- Select the hierarchies in the control hierarchy
- Select the desired viewing role from the Actions menu on the top toolbar
Memos to Describe Table Contents
To add a memo to a hierarchy:
- Select the hierarchy
- Update the memo in the right context form
View Additional Hierarchy Attributes
To view and edit additional hierarchy attributes:
- Select a hierarchy
- View the hierarchy context form on the right
Duplicate a Hierarchy
To duplicate a hierarchy:
Select the hieracrhy
Click the duplicate button on the top toolbar
1.5 - Managing Data Editors
PlaidCloud offers the ability to organize and manage data editors, including labels. Data Editors allow editing table data or creating data by user interaction.
PlaidCloud uses a path-based system to organize data editors, like you would use to navigate a series of folders, allowing for a more flexible and logical organization (control hierarchy) of the data editors. Using this system, data editors can move within a control hierarchy. Multiple references to one data editor from different locations in the control hierarchy (alternate hierarchies) can be created. The ability to manage data editors using this method allows the structure to reflect operational needs, reporting, and control.
Searching
To search for data editors:
- Use the filter box in the lower left of the control hierarchy
The search filter will search data editors’ names and labels for matches and show the results in the control hierarchy above.
Move
To move a data editor within the control hierarchy:
- Drag it into the folder where you wish to place it
Rename
To rename a data editor:
- Right click on the data editor
- Select the rename option
- Type in the new name and save it
The data editor will now be renamed but retain its original unique identifier.
Delete
You can delete a single data editor or multiple data editors.
To delete a data editor:
- Select the data editors in the control hierarchy
- Click the delete button on the top toolbar
Create New Directory Structure
To add a new folder to the control hierarchy:
- Click the New Folder button on the toolbar
To add a folder to an existing folder:
- Right-click on the folder
- Select New Folder
Mark Hierarchy for Viewing Roles
The viewing of data editors by various roles:
- Click in the Explorer or Manager checkboxes
To update multiple data editors:
- Select the data editors in the control hierarchy
- Select the desired viewing role from the Actions menu on the top toolbar
Memos to Describe Table Contents
To add a memo to a data editor:
- Select the data editor
- Update the memo in the right context form
View Additional Hierarchy Attributes
To view and edit additional data editor attributes:
- Select the data editor and view the data editor context form on the right
Duplicate a Data Editor
To duplicate a data editor:
- Select the data editor
- Click on the Duplicate button on the top toolbar
1.6 - Archive a Project
Creating an Archive
Projects normally contain critical processes and logic, which are important to archive. If you ever need to restore the project to a specific state, having archives is essential.
PlaidCloud allows you to archive projects at any point in time. Creation of archives complements the built-in point-in-time tracking of PlaidCloud by allowing for specific points in time to be captured. This might be particularly useful before a major change or to capture the exact state of a production environment for posterity.
Full backup: This includes all the data tables included in a project. The archive may be quite large, depending on the volume of data in the project.
Partial backup: This can be used if all of the project data can be derived from other sources. If this is the case, it is not necessary to archive the data in the project and have it remain elsewhere. Partial archives save time and storage space when creating the archive.
To archive a project:
- Open Analyze
- Select the “Projects” tab
Restoring an Archive
Once you have an archive, you may want to restore it. You can restore an archive into a new project or into an existing project.
To restore an archive:
- Open Analyze
- Select the “Projects” tab
Archiving Schedule
Archives can also serve as a periodic backup of your project. PlaidCloud allows you to manage the backup schedule and set the retention period of the backup archives to whatever is most convenient or desired.
Since all changes to a project are automatically tracked, archiving is not necessary for rollback purposes. However, it does provide specific snapshots of the project state, which is often useful for control purposes and/or having the ability to recover to a known point.
To set an archiving schedule:
- Open Analyze
- Select the “Projects” tab
- Click the backup icon
- Choose a directory destination in a Document account
- Choose the backup frequency and retention
- Choose which items to backup
- Click “Update”
1.7 - Viewing the Project Log
Viewing and Sorting the Project Log
As actions occur within a project, such as assigning new members or running workflows, the Project Log stores the events. The Project Log consolidates the view of all individual workflow logs in order to provide a more comprehensive view of project activities. PlaidCloud also enables the viewer to sort and filter a Project Log and view details of a particular log entry.
To view the Project Log:
- Open Analyze
- Select “Projects”
- Click the log icon
To sort and filter the Project Log:
- Click the small icon to the right of the log and to the left of the “log message”
- Select desired guidelines
To view details of a particular log entry:
- Right click on the desired log entry
- View the “Log Message” box for details
Clearing the Project Log
Clearing the Project Log may be desirable from time to time
To clear the Project Log:
- Open Analyze
- Select “Projects”
- Click the log icon
- Click the “Clear Log” button
2 - Data Management
2.1 - Using Tables and Views
Tabular data and information in PlaidCloud is stored in Greenplum data warehouses. This provides massive scalability and performance while using well understood and mature technology to minimize risk of data loss or corruption.
In addition, utilizing a data warehouse that operates with a common syntax allows 3rd party tools to connect and explore data directly. Essentially, this makes the PlaidCloud data ecosystem open and explorable while also ensuring industry leading security and access controls.
Tables
Tables hold the physical tabular data throughout PlaidCloud. Individual tables can hold many terabytes of data if needed. Data is stored across many physical servers and is automatically mirrored to ensure data integrity and high availability.
Tables consist of columns of various data types. Using an appropriate data type can help with performance and especially the storage size of your data. PlaidCloud can do a better job of compressing the data if the data is using the most appropriate data type too. This is usually guessed by PlaidCloud but it is also possible to change the data types using the column mappers in workflow steps.
Views
Views act just like tables but don't hold any physical data. They are logical representations of tables derived through a query. Using views can save on storage.
There are some limitations to the use of views though. Just be aware of the following:
- View Stacking Performance - View stacking (view of a view of a view...etc) can impact performance on very large tables or complex calculations. It might be necessary to create intermediate tables to improve performance.
- Dashboard Performance - While perfectly fine to publish a view for Dashboard use, for very large tables you may want to publish a table rather than a view for optimal user experience.
- Dynamic Data - The data in a view changes when the underlying referenced table data changes. This can be both a benefit (everything updates automatically) or an unexpected headache if the desire was a static set of data.
2.2 - Table Explorer
Table Explorer provides a powerful and readily accessible data exploration tool with built in filtering, summarization, and other features to make life easy for people working with large and complex data.
Table Explorer supports exploration on any size dataset so you can use the same tool no matter how much your data grows. It also provides point-and-click filtering along with advanced filter capabilities to zero in on the data you need. The best part is that anywhere in PlaidCloud with tables or views, you can click on those tables and views to explore with Table Explorer. By being fully integrated, data access is only a click away.
The Grid view provides a tabular view of the data. The Details view provides a summary of each column, a count of unique values, and summary statistics for numeric columns.
Data can be exported directly from a filtered set as well as being able to save and share filters with others. Finally, the filters and column settings
can be saved directly as a workflow Extract step.
The Grid View
The Grid view provides a tabular view of the data.
Setting the row limit
By default, the row limit is set to 5,000 rows. However, this can be adjusted or disabled entirely.
The rows shown along with the total size of the dataset are shown at the bottom of the table. The information provides three key pieces of information:
- The current row count shown based on the row limit applied
- The size of the global data after filters are applied
- The size of the unfiltered global data
Sorting locally versus globally
The Grid view provides the ability to click on the column header and sort the data based on that column. However, this method is only sorting the dataset that has already been retrieved and is not sorting based on the full dataset. If your retrieved data contains the entire dataset this distinction is immaterial however if your full dataset is larger than what appears in the browser, this may not be the desired sort result.
If you desire to sort the global dataset before retrieving the limited data that will appear in your browser those sorts can be applied to the columns in the Details view by clicking on the Sort icon at the top of each column. An additional benefit of using the global sort approach is that you can apply multiple sorts along with a mix of sort directions.
Quick reference column list
All of the columns in the table or view are shown on the left of the Table Explorer window by default. This column list can be toggled on and off using the column list toggle button.
The column list provides a number of quick access and useful features including:
- Double clicking an item jumps to the column in the
GridorDetailsview - Control visibility of the column through the visibility checkbox
- Use multi-select and right-click to include or exclude many columns at once
- Quickly view the data type of each column using the data type icons
- View the total column count
The Details View
The Details view provides an efficient way to view the data at a high level and exposes tools to quickly filter down to information
with point-and-click operations.
Column data and unique counts
Each column is shown, provided it is currently marked as visible. The column summary displays the top 1,000 unique values by count. The number
of unique values shown can be adjusted by selecting the Detailed Rows Displayed selection for a different value.
Managing point-and-click filters
Each column provides for point-and-click filtering by activating the filter toggle at the top of the column. Select the items in the column that you would like to include in the resulting data. Multi-select is supported.
Once you apply a filter, there may be items you wish to remove or to clear the entire column filter without clearing all filters. This is accomplished by selecting the dropdown on the column filter button and unchecking columns or selecting the clear all option at the top.
Managing Summarization
Summarization of the data can be applied by toggling the Summarize button to On. When the Summarize button is activated, each column will display
a summarization type to apply. Adjust the summarization type desired for each column.
When the desired summarizations are complete, refresh the data and the summarizations will be applied.
Examples of summarization types are Min, Max, Sum, Count, and Count Distinct.
Finding Distinct Values
Activating the Distinct button will help reduce the data to only a set of unique records. When the Distinct button is active, a Distinct checkbox will appear on each column. Uncheck the columns that DO NOT define uniqueness of the column to the dataset. For example, if you want to find the unique set of customers in a customer order table, you would only want to select the customer column rather than including the customer order number too.
Summary statistics for numeric columns
Integer and numeric columns automatically display summary statistics at the bottom of the column information. This includes:
- Min
- Max
- Mean
- Sum
- Standard Deviation
- Variance
These statistics are calculated on the full filtered dataset.
Copying Data
It is sometimes useful to allow for copying of selected data from PlaidCloud so that it can be pasted into other applications such as a spreadsheet.
From the Copy button in the upper right, there are several copy options available for the data:
- Copy All - Copies all of the data to the clipboard
- Copy Selection - Copies the selected data to the clipboard
- Copy Cell - Copies only the contents of a single cell to the clipboard
- Copy Column - Copies the full contents of the column to the clipboard
Exporting Data
Exporting data from the Table Explorer interface allows exporting of the filtered data with only the columns visible. You can export in the following formats:
- Microsoft Excel (xlsx)
- CSV (Comma)
- TSV (Tab)
- PSV (Pipe)
The Download menu also offers the ability to download only the rows visible in the browser. This is based on using the row limit specified.
Additional Actions
Additional useful actions are available under the Actions menu.
Save as Extract Step
When exploring data, it is often in the context of determining how to filter it for a data pipeline process. This often consists of applying multiple filters including advanced filters to zero in on the desired result.
Instead of attempting to replicate all the filters, columns, summarizations, and sorts in an Extract Step, you can simply save the existing Table Explorer settings as a new Extract Step.
Save as View
Similar to saving the current Table Explorer settings as an Extract Step above, you can also save the settings directly as a view.
This can be particularly useful when trying to construct slices of data for reporting or other downstream processes that don't require a a data pipeline.
Manage Saved Filters
You never have to lose your filter work. You can save your Table Explorer settings as a saved filter. Saved filters also include column visibility, summarizations, columns filters, advanced filters, and sorts.
You can also let others use a saved filter by checking the Public checkbox when saving the filter.
From the Actions menu you can also choose to delete and rename saved filters.
Advanced Filters
While point-and-click column filters allow for quick application of filters to zero in on the desired results, sometimes filter conditions are complex and need more advanced specifications.
The advanced filter area provides both a pre-aggregation filter as well as a post-aggregation filter, if Summarize is enabled.
Any valid Python expression is acceptable to subset the data. Please see Expressions for more details and examples.
2.3 - Using Dimensions (Hierarchies)
PlaidCloud natively manages dimension (i.e. hierarchical) data through our proprietary hierarchy storage system. We decided to construct our own from purpose-built solution because other commercial and open-source solutions seem to present limitations that were not easily overcome.
The hierarchy storage supports not only hierarchical relationships but also properties, aliases, attributes, and values. It is also designed to operate on large structures and perform operations quickly including complex branch and leaf navigation.
Dimensions are managed in the Dimensions tab within each PlaidCloud project configuration area.
Main Hierarchy
Each dimension (i.e. hierarchical dataset) always consists of a main hierarchy. Every member of the hierarchy is represented here.
Having a main hierarchy helps establish the complete set of leaf nodes in the dimension.
Alternate or Attribute Hierarchies
Alternate hierarchies are different representations of the main hierarchy leaf nodes. Alternate hierarchies can consist of a subset of both
leaf nodes and roll-up (i.e. folders) in the main hierarchy as well as its own set of unique roll-ups.
This provides for the maximum amount of flexibility by automatically updating alternate hierarchies when children of a roll-up change or to strictly control the alternate hierarchy members by specifying only the leaf nodes required.
main hierarchy have attribute labels showing alternate hierarchies for which they also belongManaging Dimensions
Creating a Dimension
From the New button in the toolbar, select New Dimension. Enter in the desired name, directory, and a descriptive memo.
Once you press the Create button the dimension will be created and ready for immediate use.
You can also create a dimension from a workflow using the Dimension Create workflow step.
Deleting a Dimension
To delete an existing dimension, select the dimension record and open the Actions menu in the upper right. Select Delete Dimension.
This will delete the dimension and all underlying data.
You can also delete a dimension from a workflow using the Dimension Delete workflow step.
It is also possible to clear the dimension of all structure, values, aliases, properties, and alternate hierarchies without deleting the dimension by using the Dimension Clear workflow step.
Copying a Dimension
To copy an existing dimension, select the dimension record and open the Actions menu in the upper right. Select Copy Dimension.
This will open a dialog where you can specify the name of the copy. Click the Create Copy button to make a copy of the dimension
including values, aliases, properties, and alternate hierarchies.
Sorting a Dimension
The dimension management area makes it easy to move hierarchy members up and down as well as changing parents. It also makes it easy to create and delete members.
However, it can get tedious when manually moving hierarchy items around so you can sort a dimension from a workflow using the Dimension Sort workflow step. This can be a big time saver especially after data loads or major changes.
Loading Dimensions
Since dimensions represent hierarchical data structures, the load process must convey the relationships in the data. PlaidCloud supports two different data structures for loading dimensions:
- Parent-Child - The data is organized vertically with a Parent column and Child column defining each parent of a child throughout the structure
- Levels - The data is organized horizontally with each column representing a level in the hierarchy from left to right
In addition to structure, other dimension information can be included in the load process such as values, aliases, and properties.
See the Workflow Step for Dimension Load for more information.
Dimension Property Inheritance
A dimension may inherit a property from an ancestor. To enable inheritance, click the dropdown next to Properties and select Inherited Properties. All child nodes in the dimension will now inherit the propties of its parents.
Usage Notes:
- Inheritance will happen for all properties in a dimension. You cannot set inheritance on one property but not another.
- If you change and then delete the value of a child property, it will default back to the parent value. You cannot have a null value when the parent has a value.
- If you set the value of a child property, its children will inherit the child property instead of the parent.
- Inheritance will go all the way down to the leaf node.
2.4 - Publishing Tables
Since data pipelines can generate many intermediate tables and views useful for validation and process checks but not suitable for final results reporting,
PlaidCloud provides a Publish process to help reduce the noise when building Dashboards or pulling data in PlaidXL. The Publish process helps clarify
which tables and views are final and reliable for reporting purposes.
Publish
From the Tables tab in a PlaidCloud project configuration, find the table you wish to publish for use in dashboards and PlaidXL. Right-click on the
table record and select Set Published Table Reporting Name from the menu.
This will open a dialog where you can specify a unique published name. This name does not need to be the same as the table or view name. Enabling a different name is often useful when referencing data sources in dashboards and PlaidXL because it can provide a friendlier name to users.
Once the table or view is published, its published name will appear in the Published As column in the Tables view.
Unpublish
Unpublishing a table or view is similar to the publish process. From the Tables tab in a PlaidCloud project configuration, find the table you wish
to publish for use in dashboards and PlaidXL. Right-click on the table record and select Set Published Table Reporting Name from the menu.
When the dialog appears to set the published name, select the Unpublish button. This will remove the table from Dashboard and PlaidXL usage.
The published name will no longer appear in the Published As column.
Renaming
Renaming a table or view is similar to the publish process. From the Tables tab in a PlaidCloud project configuration, find the table you wish
to publish for use in dashboards and PlaidXL. Right-click on the table record and select Set Published Table Reporting Name from the menu.
When the dialog appears change the publish name to the new desired name. Press the Publish button to update the name.
The updated name will now appear in the Published As column as well as in Dashboard and PlaidXL.
3 - Workflows
3.1 - Where are the Workflows
Workflows exist within a Project. From the top menu in the Analyze menu click on the Projects menu item. This will open the Projects hierarchy showing the list of projects. Open the project and navigate to the Workflows tab to see the workflows in the project. Workflows are organized in a hierarchy.
The list of projects you can see is determined by your access security for each project and your Viewing Role within the project (i.e. Architect, Manager, or Explorer). If you are expecting to see a project and it is not present, it could be that you have not been granted access to the project by one of the project owners. If you are expecting to see certain workflows, but you are not an Architect on the project, then they might be hidden from your viewing role.
The status of the workflow will be displayed if it is running, has a warning or error, or was completed normally. The creation and update dates are also shown along with who created or updated the workflow.
The Workflow Explorer can be opened by double clicking on a workflow. You can then view the steps, execute a workflow or a part of a workflow, and so on.
3.2 - Workflow Explorer
To view the details within a workflow, find it in the project and then double click on it to open up the workflow in the explorer.
From here, you can manage Workflow Steps including creating or modifying existing workflow steps, changing the order, executing steps, and so on.
3.3 - Create Workflow
Once you navigate to the Workflows tab in a project, click on the New Workflow button. This will open a form where you can enter in the details of the workflow including the name and memo.
In addition, you can set a remediation workflow to run if the workflow ends in an error. A remediation workflow does not need to be set but can be useful for sending notifications or triggering other processes that may automatically remediate failures.
Once the form is complete, click on the Create button and the new workflow will be added to the project.
3.4 - Duplicate a Workflow
It may be useful to copy a workflow when planning to make major changes or to replicate the process with different options. Duplicating an entire workflow is very easy in PlaidCloud. Simply select the workflows you would like to duplicate in the Workflows table of a selected project and click the Duplicate Selected Workflows button at the top of the table. This will copy the workflows and append the word Copy to the name.
Once the duplication process is complete, the workflow is fully functional. Copied workflows are completely separate from the original and can be modified without impacting the original workflow.
3.5 - Copy & Paste steps
Copy Steps
It is often useful to copy steps instead of starting from scratch each time. PlaidCloud allows copying steps within workflows as well as between workflows, and even in other projects. You can select multiple steps to copy at once. Select the workflow steps within the hierarchy and click the Copy Selected Steps button at the top of the table.
This will place the selected steps in the clipboard and allow pasting within the current workflow or another one.
Copying a step will make a duplicate step within the project. If you want to place the same step in more than one location in a workflow, use the Add Step menu option to add a reference to the same step rather than a clone of the original step.
Paste Steps
After selecting steps to copy and placing them on the clipboard, you can paste those steps into the same workflow or another workflow, even in another project. There are two options when pasting the steps into the workflow:
- Append to the end of the workflow
- Insert after last selected row
The append option will simply append the steps to the end of the selected workflow. The insert option will insert the copied steps after the selected row. Note that if multiple steps have been copied to the clipboard from multiple areas in a workflow, that pasting them will paste them in order but will not have any nested hierarchy information from when they were copied. The pasting will be a flat list of steps to insert only. This might be unexpected but is safer than creating all of the directory structure in the target workflow that existed in the source workflow.
3.6 - Change the order of steps in a workflow
There are two ways to update the order of steps in the workflow. The first way is to use the up and down arrows present in the Workflows table to move the step up or down. The second way is to use the Step Move option which allows you to move the step much easier if large changes are necessary. The step move option allows you to move the step to the top, bottom, or after a specific step in one operation.
3.7 - Run a workflow
You can trigger a full workflow run by either clicking on the run icon from the Workflows hierarchy or by selecting Run All from the Actions menu within a specific workflow.
You can also click on the Toggle Start/Stop button at the top of the workflow table. This toggle button will stop a running workflow or start a workflow.
3.8 - Running one step in a workflow
During initial workflow development, testing, or troubleshooting, it is often useful to run steps individually. To run a single step in isolation, right click on the step and select Run Step from the context menu.
3.9 - Running a range of steps in a workflow
While running individual steps is useful, it also may be useful to run subsets of an entire workflow for development, testing, or troubleshooting. To run a subset of steps, select all the steps you would like to run and select Run Selected from the Actions menu at the top of the workflow steps hierarchy. This will trigger a normal workflow processing but start the workflow at the beginning of the selected steps and stop once the last selected step is complete.
3.10 - Managing Step Errors
If a workflow experiences an error during processing, an error indicator is displayed on both the workflow and the step that had the error. PlaidCloud can retry a failed step multiple times. This is often useful if the step is accessing remote systems or data that may not be highly available or intermittently fail for unknown reasons. The retry capability can be set to retry many times as well as add a delay between retries from seconds to hours.
If no retry is selected or the maximum number of retries is exceeded, then the step will be marked as an error. PlaidCloud provides three levels of error handling in that case:
- Stop the workflow when an error occurs
- Mark the step as an error but keep processing the workflow
- Mark the step as an error and trigger a remediation workflow process instead of continuing the current workflow
Stop the Workflow
Stopping the workflow when a step errors is the most common approach since workflows generally should run without errors. This will stop the workflow and present the error indicator on both the step and the workflow. The error will also be displayed in the activity monitor but no further action is taken.
Keep Processing
Each step can be set to continue on error in the step form. If this checkbox is enabled, then any step will be marked with an error if it occurs, but the workflow will treat the error as a completion of the step and continue on. This is often useful if there are steps that perform tasks that can error when there is missing data but are harmless to the overall processes.
Since the workflow is continuing on error under this scenario the workflow will not display an error indicator and continue to show a running indicator.
Trigger Remediation Workflow
With the ability to set a remediation workflow as part of the workflow setup, a workflow error will immediately stop the processing of the current workflow and start processing the remediation workflow. Note that if a step is marked to continue on error that a failure will not trigger the remediation workflow. Only steps that fail that would also cause the entire workflow to stop will trigger the remediation process.
A remediation workflow may be useful for simply notifying people that a failure has occurred or it can perform other complex processing to attempt an automatic correction of any underlying reasons the original workflow failed.
3.11 - Continue on Error
Workflow steps can be set to continue processing even when there is an error. This might be useful in workflow start-up conditions or where data may be available intermittently. If the step errors, it will be recorded as an error but the workflow will continue to process.
To set this option, click on the step edit option, the pencil icon in the workflow table, to open the edit form. Check the checkbox for Continue On Error. After saving the updated step, any errors with the step will not cause the workflow to stop.
Steps that have been set to continue on error will have a special indicator in the workflow steps hierarchy table.
3.12 - Skip steps in a workflow
Steps in the workflow can be set to skip during the workflow run. This may be useful if there are debugging steps or old steps that you are not prepared to completely remove from the workflow yet. To set this option, you have two options:
- Edit the step form
- Uncheck the enabled checkbox in the workflow hierarchy
To edit the step form, click on the step edit option, the pencil icon in the workflow table, to open the edit form. Uncheck the enabled checkbox. After saving the updated step it will no longer run as part of the workflow but can still be run using the single step run process.
Steps that have been set to disabled will have a disabled indicator in the workflow steps hierarchy table.
3.13 - Conditional Step Execution
Overview
Workflow steps normally execute in the defined order for the workflow. However, it is often useful to have certain steps only execute if predefined conditions are met. By using the step conditions capability you can control execution based on the following options:
- Variable values
- Table has rows or is empty
- A document or folder exists in Document
- A document or folder is missing in Document
- Table query result
- Date and time conditions are met
For variables or table query result comparisons you can use the following comparisons:
- Equal
- Does not equal
- Contains
- Does not contain
- Starts with
- Ends with
- Greater than
- Less than
- Greater than or equal
- Less than or equal
What is also important to note is that you can have multiple conditions that must be met in order for the step to execute. This provides a powerful tool for controlling exactly when a step should execute.
Adding and Controlling Conditions
To activate and add conditions on a step:
- Find the step you want to add a condition on
- Click the Edit Step Details (pencil) icon
- Select the Conditions tab.
- Check the Check Conditions Before Running checkbox to enable the dialog and add conditions.
- In the Condition Checks section on the left, select the "+" to add a New Condition
- Add a condition from the tabbed section on the right
- Repeat steps 5,6 as needed to add all your conditions
Managing Conditions
You can add as many conditions as necessary in the Conditions Check section. As you add them, it is a good idea to give them a useful name so you can find the conditions easily in the future.
Once you add a condition, select it on the left and the condition evaluation criteria will be editable on the right.
Variable Conditions
When checking variable conditions, the Value Check Parameters section must be completed so a comparison can be made.
In the Variable or Table Field fill in the variable name. Select a comparison type and enter a comparison value.
Basic Table Conditions
If the condition is checking whether a table has rows or is empty, you will also need to define the table in the Table Data Selection tab.
Advanced Table Conditions
When using Advanced Table conditions, the Value Check Parameters section must be completed so a comparison can be made.
In the Variable or Table Field fill in the field name from the table selection. Select a comparison type and enter a comparison value.
In the Table Data Selection tab, select the table and complete the data mapping section with at least the field referenced for the condition comparison.
Document Path Conditions
If the condition is checking whether a document or folder exists, this requires picking the Document account and specifying the document path to check in the Document Path tab.
Date and Time Conditions
For Date or Time selections you can add multiple conditions if a combination of conditions is necessary. For example, if you only wanted a step to run on Mondays at 2:05am, you would create three conditions:
- Day of the week condition set to Monday (1)
- Hour of the day set to 2
- Minute of the hour set to 5
For "Use Financial Close Workday", set that to the xth day of the month that your close happens on. For example, if your close happens on the 5th day of the month, have "5".
3.14 - Controlling Parallel Execution
Workflows in PlaidCloud can be executed as a combination of serial steps and parallel operations. To set a group of steps to run in parallel, place the steps in a group within the workflow hierarchy. Right click on the group folder and select the Execute in Parallel option. This will allow all the steps in the group to trigger simultaneously and execute in parallel. Once all steps in the group complete, the next step or group in the workflow after the group will activate.
3.15 - Manage Workflow Variables
PlaidCloud allows variables at both the project scope and workflow scope. This allows for setting project wide variables or being able to pass information easily between workflows. The variables and values are viewed by clicking on the variables icon in the Workflows hierarchy.
From the variables table you can view the variables, the current values, and edit the values. You can also add new variables or delete existing ones.
3.16 - Viewing Workflow Log
Viewing the Workflow Log
As things happen within a workflow, such as steps running or warnings occurring, those events are logged to the workflow log. This log is viewable from the Project area under the Log tab. The workflow log is also present in the project log in case you would like to see a more comprehensive view of logs across multiple workflows.
The log viewer allows for sorting and filtering the log as well as viewing the details of a particular log entry.
Clearing the Workflow Log
Clearing the workflow log may be desirable from time to time. From the log viewer, select the Clear Log button. This will clear the log based on the workflow selected which will also remove the log entries from the project level log too.
3.17 - View Workflow Report
Maintaining detailed documentation to support both statutory and management requirements is challenging when the projects and workflows may be dynamic. To help solve this problem, PlaidCloud provides a Workflow level report that provides detailed documentation of workflows, workflow steps, user defined functions, and variables.
The report is generated on-demand and reflects the current state of the workflow. To download the report click on the Report icon in the Workflows hierarchy.
3.18 - View a dependency audit
The Workflow Dependency Audit is a very helpful tool to understand data and workflow dependencies in complex interconnected workflows. Over time, as workflow processes become more complex, it may become challenging to ensure all dependencies are in the correct order. When data already exists in tables, steps will run and appear correct in many cases but may actually have a dependency issue if the data is populated out of order.
This tool will provide a dependency audit and identify issues with data dependency relationships.
4 - Workflow Steps
4.1 - Workflow Control Steps
4.1.1 - Create Workflow
Description
Create a new PlaidCloud Analyze workflow.
Workflow to Create
First, select the Project in which the new workflow should be created from the dropdown menu.
Next, type in a workflow name. The name should be unique to the Project.
Examples
No examples yet...
4.1.2 - Run Workflow
Description
“Run Workflow” runs an existing workflow.
Workflow to Run
First, select the Project which contains the workflow to be run from the Project dropdown menu.
Next, select the particular workflow to be run from the Workflow dropdown menu.
Additionally, there is an option to Wait until processing completes before continuing. Selecting this checkbox will defer execution of the current workflow until the called workflow is completed with its execution. By default, this option is disabled, meaning that the current workflow in which this transform resides will continue processing in parallel along with the called workflow.
Examples
No examples yet...
4.1.3 - Stop Workflow
Description
“Stop Workflow” stops an existing, running workflow.
Workflow to Stop
First, select the Project which contains the workflow to be stopped from the Project dropdown menu.
Next, select the particular workflow to be stopped from the Workflow dropdown menu.
Examples
No examples yet...
4.1.4 - Copy Workflow
Description
Make a copy of an existing PlaidCloud Analyze workflow.
Workflow to Copy
First, select the Project which contains the workflow to be copied from the Project dropdown menu.
Next, select the particular workflow to be copied from the Workflow dropdown menu.
Next, enter the new workflow name into the New Workflow field. Remember: the name should be unique to the Project.
Examples
No examples yet...
4.1.5 - Rename Workflow
Description
Rename an existing PlaidCloud Analyze workflow.
Workflow to Rename
First, select the Project which contains the workflow to be renamed from the Project dropdown menu.
Next, select the particular workflow to be renamed from the Workflow dropdown menu.
Finally, enter the new workflow name in the Rename To field. Remember that the name should be unique to the Project.
Examples
No examples yet...
4.1.6 - Delete Workflow
Description
Delete an existing PlaidCloud Analyze workflow.
Workflow to Delete
First, select the Project which contains the workflow to be deleted from the Project dropdown menu.
Next, select the particular workflow to be deleted from the Workflow dropdown menu.
Examples
No examples yet...
4.1.7 - Set Project Variable
Description
“Set Project Variable” sets project variables for use during the workflow. A variable name and value may contain any combination of valid characters, including spaces. Variables are referenced within the workflow by placing them inside curly braces. For example, a_variable is referenced within a transform as {a_variable} so it could be used in something like a formula or field value (e.g., {a_variable} * 2).
Variable List
The table will display the list of registered project variables and the current values. Enter the value for the variable desired. It’s also possible to set variable values without registering the variable first by simply adding the variable to the list.
Examples
No examples yet...
4.1.8 - Set Workflow Variable
Description
“Set Workflow Variable” sets workflow variables for use during the workflow. A variable name and value may contain any combination of valid characters, including spaces. Variables are referenced within the workflow by placing them inside curly braces. For example, a_variable is referenced within a transform as {a_variable} so it could be used in something like a formula or field value (e.g. {a_variable} * 2).
Variable List
The table will display the list of registered workflow variables and the current values. Enter the value for the variable desired. It’s also possible to set variable values without registering the variable first by simply adding the variable to the list.
Examples
No examples yet...
4.1.9 - Worklow Loop
Description
Loops over a dataset and runs a specific workflow using the values of the looping dataset as Project variables.
Workflow to Stop
First, select the Project which contains the workflow that will be run on each loop from the Project dropdown menu.
Next, select the particular workflow for running from the Workflow dropdown menu.
Examples
Examples coming soon
4.1.10 - Raise Workflow Error
Description
Raise an error in a PlaidCloud Analyze workflow.
Raise Workflow Error
Mainly for use with step conditions, the step can be set to execute if conditions are met and raise an error within the workflow
4.1.11 - Clear Workflow Log
Description
Clear the log from an existing PlaidCloud Analyze workflow.
Workflow Log to Clear
First, select the Project which contains the workflow log to be cleared from the Project dropdown menu.
Next, select the particular workflow log to be cleared from the Workflow dropdown menu.
4.2 - Import Steps
4.2.1 - Import Archive
Description
Imports PlaidCloud table archive.
Examples
No examples yet...
Import Parameters
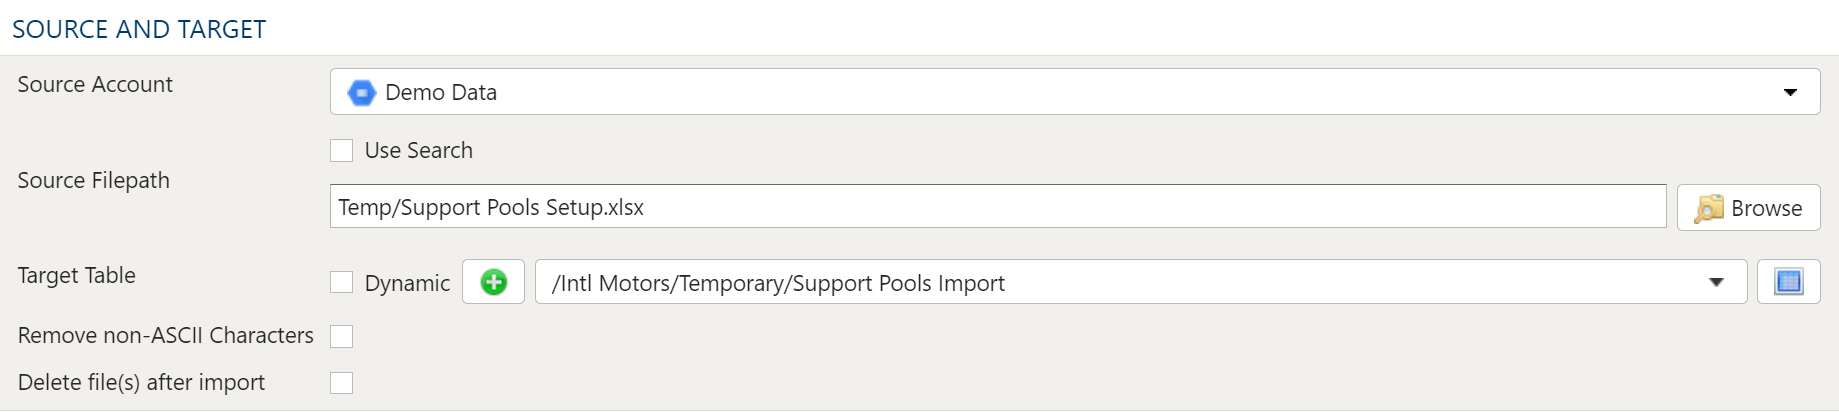
The file selector in this transform allows you to choose a file stored in a PlaidCloud Document location for import.
You can also choose a directory to import and all files within that directory will be imported as part of the transform run.
Source Account
Choose a PlaidCloud Document account for which you have access. This will provide you with the ability to select a directory or file in the next selection.
Search Option
The Search option allows for finding all matching files below a specified directory path to import. This can be particularly useful if many files need to be included but they are stored in nested directories or are mixed in with other files within the same directory which you do not want to import.
The search path selected is the starting directory to search under. The search process will look for all files within that directory as well as sub-directories that match the search conditions specified. Ensure the search criteria can be applied to the files within the sub-directories too.
The search can be applied using the following conditions:
- Exact: Match the search text exactly
- Starts With: Match any file that starts with the search text
- Contains: Match any file that contains the search text
- Ends With: Match any file that ends with the search text
Source FilePath
When a specific file or directory of files are required for import, picking the file or directory is a better option than using search.
To select the file or directory, simply use the browse button to pick the path for the Document account selected above.
Variable Substition
For both the search option and specific file/directory option, variables can be used with in the path, search text, and file names.
An example that uses the current_month variable to dynamically point to the correct file:
legal_entity/inputs/{current_month}/ledger_values.csv
Target Table
The target selection for imports is limited to tables only since views do not contain underlying data.
Dynamic Option
The Dynamic option allows specification of a table using text, including variables. This is useful when employing variable driven workflows where table and view references are relative to the variables specified.
An example that uses the current_month variable to dynamically point to target table:
legal_entity/inputs/{current_month}/ledger_values
Static Option
When a specific table is desired as the target for the import, leave the Dynamic box unchecked and select the target Table.
If the target Table does not exist, select the Create new table button to create the table in the desired location.
Table Explorer is always avaible with any table selection. Click on the Table Explorer button to the right of the table selection and a Table Explorer window will open.
Remove non-ASCII Characters Option
By selecting this option, the import will remove any content that is not ASCII. While PlaidCloud fully supports Unicode (UTF-8), real-world files can contain all sorts of encodings and stray characters that make them challenging to process.
If the content of the file is expected to be ASCII only, checking this box will help ensure the import process runs smoothly.
Delete Files After Import Option
This option will allow the import process to delete the file from the PlaidCloud Document account after a successful import has completed.
This can be useful if the import files are generated can be recreated from a system of record or there is no reason to retain the raw input files once they have been processed.
4.2.2 - Import CSV
Description
Import delimited text files from PlaidCloud Document. This includes, but is not limited to, the following delimiter types:
- comma (, )
- pipe (|)
- semicolon (; )
- tab
- space ( )
- at symbol (@)
- tilda (~)
- colon (:)
Examples
No examples yet...
Import Parameters
The file selector in this transform allows you to choose a file stored in a PlaidCloud Document location for import.
You can also choose a directory to import and all files within that directory will be imported as part of the transform run.
Source Account
Choose a PlaidCloud Document account for which you have access. This will provide you with the ability to select a directory or file in the next selection.
Search Option
The Search option allows for finding all matching files below a specified directory path to import. This can be particularly useful if many files need to be included but they are stored in nested directories or are mixed in with other files within the same directory which you do not want to import.
The search path selected is the starting directory to search under. The search process will look for all files within that directory as well as sub-directories that match the search conditions specified. Ensure the search criteria can be applied to the files within the sub-directories too.
The search can be applied using the following conditions:
- Exact: Match the search text exactly
- Starts With: Match any file that starts with the search text
- Contains: Match any file that contains the search text
- Ends With: Match any file that ends with the search text
Source FilePath
When a specific file or directory of files are required for import, picking the file or directory is a better option than using search.
To select the file or directory, simply use the browse button to pick the path for the Document account selected above.
Variable Substition
For both the search option and specific file/directory option, variables can be used with in the path, search text, and file names.
An example that uses the current_month variable to dynamically point to the correct file:
legal_entity/inputs/{current_month}/ledger_values.csv
Target Table
The target selection for imports is limited to tables only since views do not contain underlying data.
Dynamic Option
The Dynamic option allows specification of a table using text, including variables. This is useful when employing variable driven workflows where table and view references are relative to the variables specified.
An example that uses the current_month variable to dynamically point to target table:
legal_entity/inputs/{current_month}/ledger_values
Static Option
When a specific table is desired as the target for the import, leave the Dynamic box unchecked and select the target Table.
If the target Table does not exist, select the Create new table button to create the table in the desired location.
Table Explorer is always avaible with any table selection. Click on the Table Explorer button to the right of the table selection and a Table Explorer window will open.
Remove non-ASCII Characters Option
By selecting this option, the import will remove any content that is not ASCII. While PlaidCloud fully supports Unicode (UTF-8), real-world files can contain all sorts of encodings and stray characters that make them challenging to process.
If the content of the file is expected to be ASCII only, checking this box will help ensure the import process runs smoothly.
Delete Files After Import Option
This option will allow the import process to delete the file from the PlaidCloud Document account after a successful import has completed.
This can be useful if the import files are generated can be recreated from a system of record or there is no reason to retain the raw input files once they have been processed.
Inspect Selected Source File
By pressing the Guess Settings from Source File button, PlaidCloud will open the file and inspect it to attempt to determine the data format. Always check the guessed settings to make sure they seem correct.
Data Format
Delimiter
As mentioned above, Inspect Source File will attempt to determine the delimiter in the source file. If another delimiter is desired, use this section to specify the delimiter. Users can choose from a list of standard delimiters.
- comma (, )
- pipe (|)
- semicolon (; )
- tab
- space ( )
- at symbol (@)
- tilda (~)
- colon (:)
Header Type
Since CSVs may or may not contain headers, PlaidCloud provides a way to either use the headers, ignore headers, or use column order to determine the column alignment.
- No Header: The CSV file contains no header. Use the source list in the Data Mapper to determine the column alignment
- Has Header - Use Header and Override Field List: The CSV file has a header. Use the header names specified and ignore the source list in the Data Mapper.
- Has Header - Skip Header and Use Field List Instead: The CSV file has a header but it should be ignored. Use the header names specified by the source list in the Data Mapper.
Date Format
This setting is useful if the dates contained in the CSV file are not readily recognizable as dates and times. The import process attempts to convert dates but having a little extra information can help in the import process.
Special Characters
The special character inputs control how PlaidCloud handles the presence of certain characters and what they mean in the context of processing the CSV
- Quote Character: This is the character used to indicate an enclosed set of text that should be processed as a single field
- Escape Character: This is the character used to indicate the following character should be processed as it is and not interpreted as a special character. Useful when field may contain the delimiter.
- Null Character: Since CSVs don't have data types, this character provides a way to indicate that the value should be NULL rather than an empty string or 0.
- Trailing Negatives: Some source systems generate negative numbers with trailing negative symbols instead of prefixing the negative. This setting will process those as negative numbers.
Row Selection
For input files with extraneous records, you can specify a number of rows to skip before processing the data. This is useful if files contain header blocks that must be skipped before arriving at the tabular data.
Table Data Selection
Data Mapper Configuration
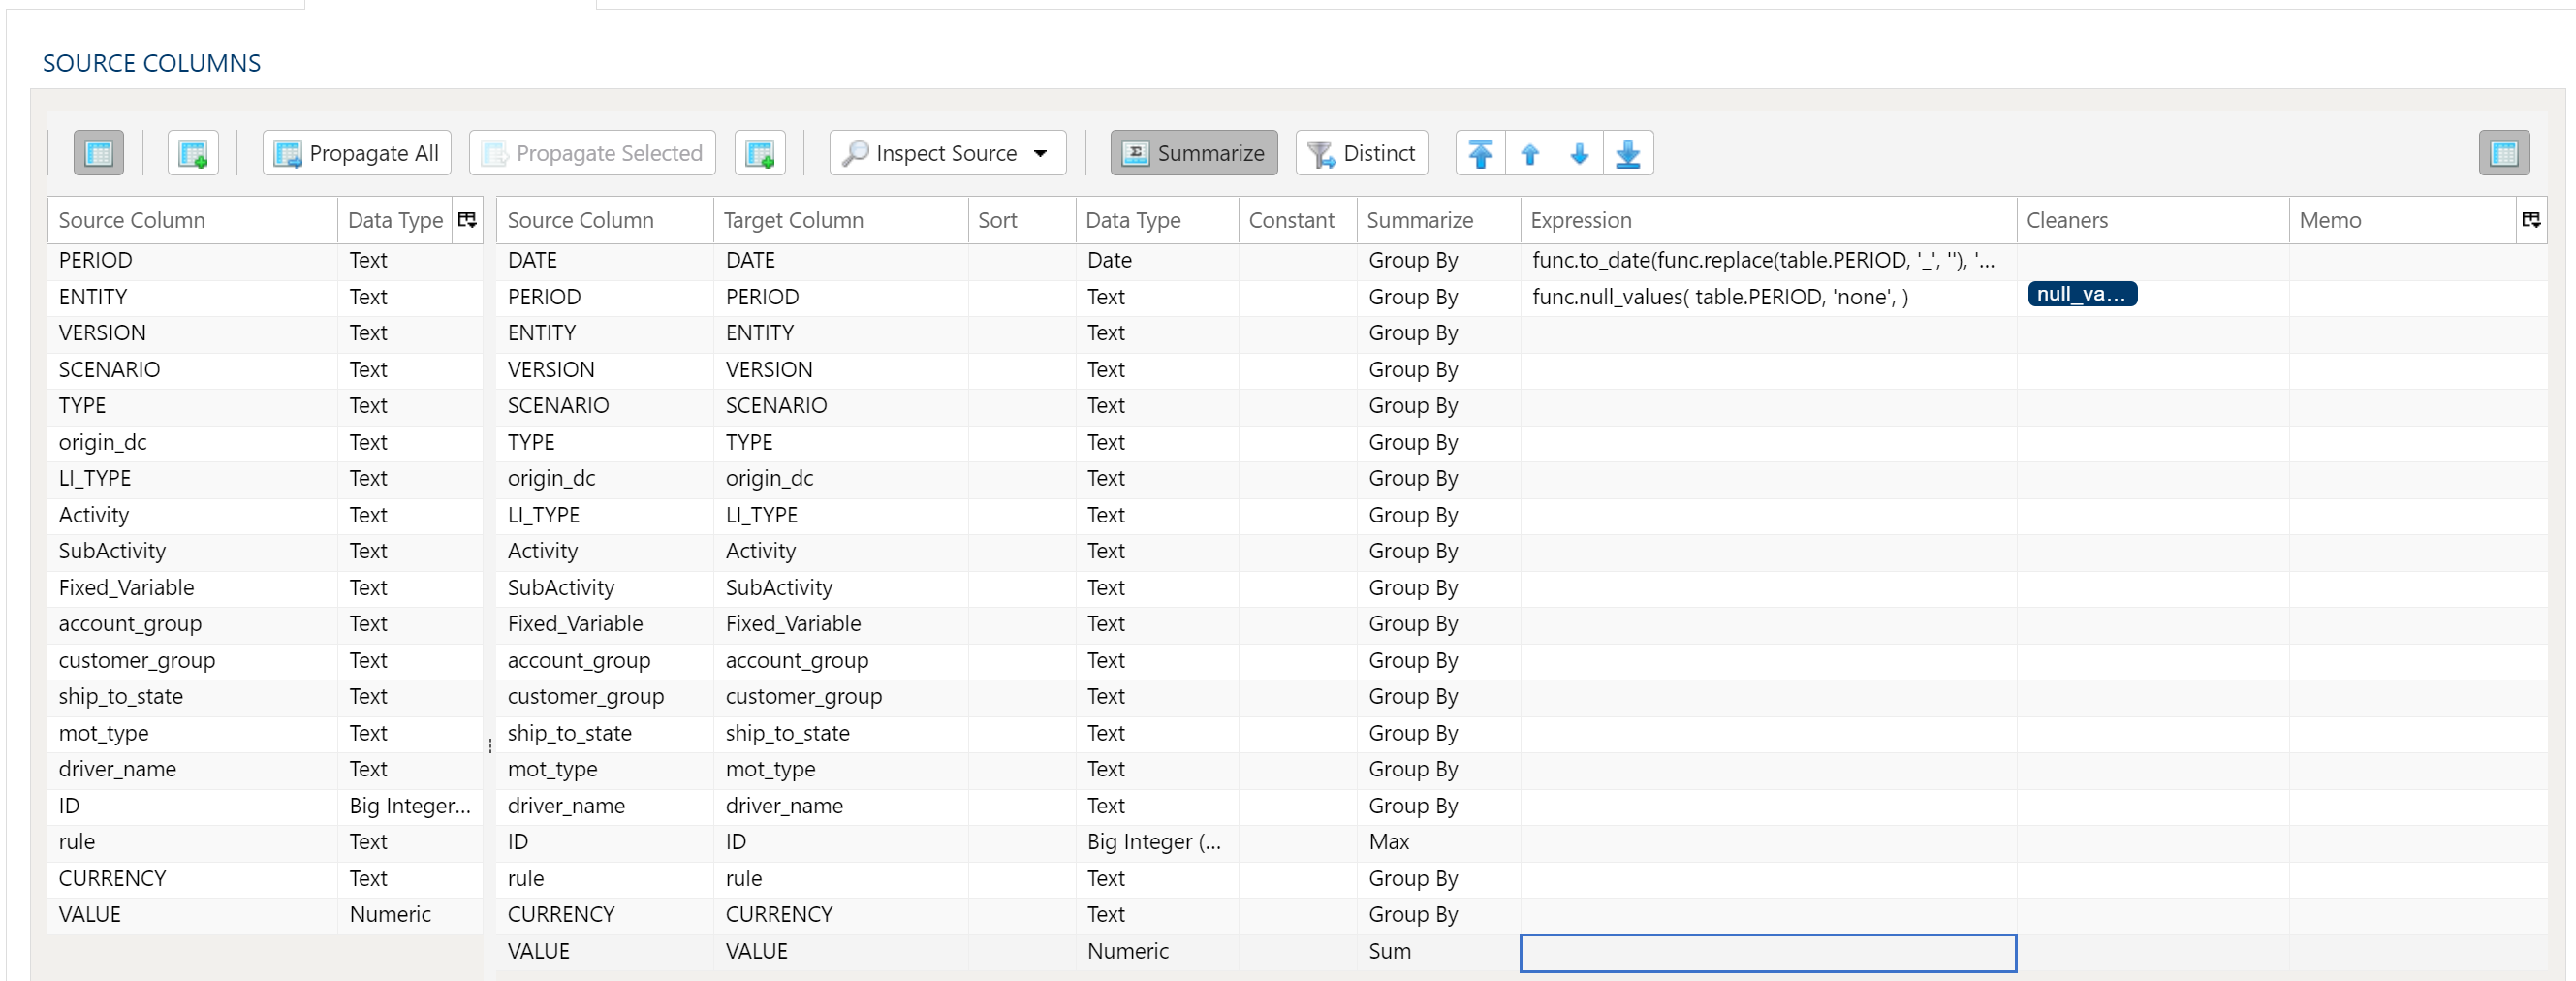
The Data Mapper is used to map columns from the source data to the target data table.
Inspection and Populating the Mapper
Using the Inspect Source menu button provides additional ways to map columns from source to target:
- Populate Both Mapping Tables: Propagates all values from the source data table into the target data table. This is done by default.
- Populate Source Mapping Table Only: Maps all values in the source data table only. This is helpful when modifying an existing workflow when source column structure has changed.
- Populate Target Mapping Table Only: Propagates all values into the target data table only.
If the source and target column options aren’t enough, other columns can be added into the target data table in several different ways:
- Propagate All will insert all source columns into the target data table, whether they already existed or not.
- Propagate Selected will insert selected source column(s) only.
- Right click on target side and select Insert Row to insert a row immediately above the currently selected row.
- Right click on target side and select Append Row to insert a row at the bottom (far right) of the target data table.
Deleting Columns
To delete columns from the target data table, select the desired column(s), then right click and select Delete.
Chaging Column Order
To rearrange columns in the target data table, select the desired column(s). You can use either:
- Bulk Move Arrows: Select the desired move option from the arrows in the upper right
- Context Menu: Right clikc and select Move to Top, Move Up, Move Down, or Move to Bottom.
Reduce Result to Distinct Records Only
To return only distinct options, select the Distinct menu option. This will toggle a set of checkboxes for each column in the source. Simply check any box next to the corresponding column to return only distinct results.
Depending on the situation, you may want to consider use of Summarization instead.
The distinct process retains the first unique record found and discards the rest. You may want to apply a sort on the data if it is important for consistency between runs.
Aggregation and Grouping
To aggregate results, select the Summarize menu option. This will toggle a set of select boxes for each column in the target data table. Choose an appropriate summarization method for each column.
- Group By
- Sum
- Min
- Max
- First
- Last
- Count
- Count (including nulls)
- Mean
- Standard Deviation
- Sample Standard Deviation
- Population Standard Deviation
- Variance
- Sample Variance
- Population Variance
- Advanced Non-Group_By
For advanced data mapper usage such as expressions, cleaning, and constants, please see the Advanced Data Mapper Usage
Data Filters
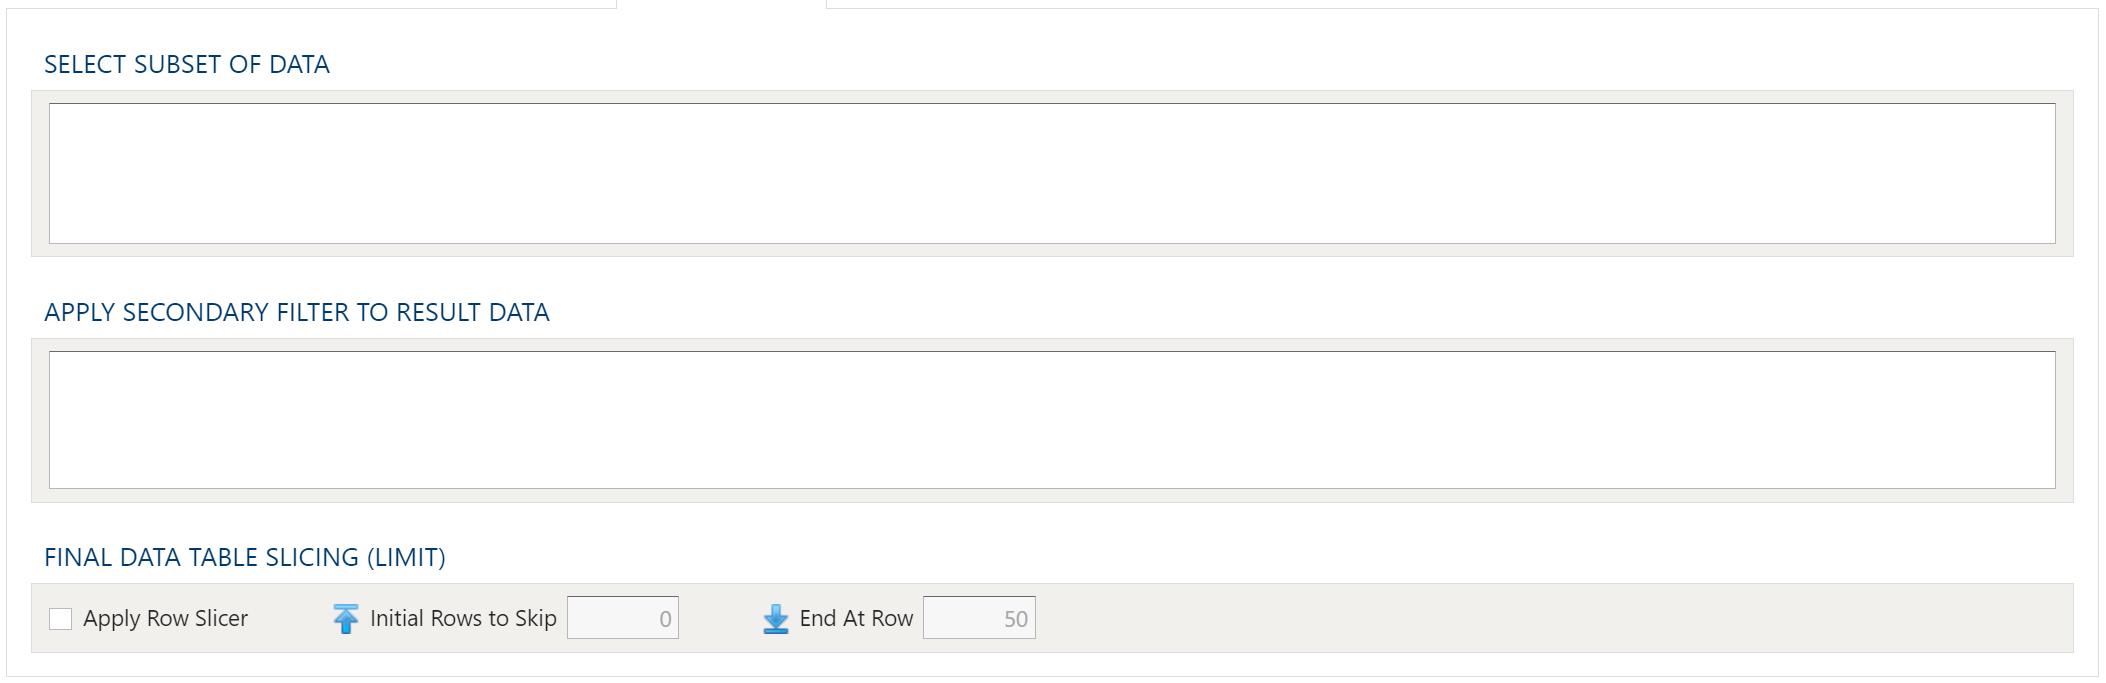
To allow for maximum flexibility, data filters are available on the source data and the target data. For larger data sets, it can be especially beneficial to filter out rows on the source so the remaining operations are performed on a smaller data set.
Select Subset Of Data
This filter type provides a way to filter the inbound source data based on the specified conditions.
Apply Secondary Filter To Result Data
This filter type provides a way to apply a filter to the post-transformed result data based on the specified conditions. The ability to apply a filter on the post-transformed result allows for exclusions based on results of complex calcuations, summarizaitons, or window functions.
Final Data Table Slicing (Limit)
The row slicing capability provides the ability to limit the rows in the result set based on a range and starting point.
Filter Syntax
The filter syntax utilizes Python SQLAlchemy which is the same syntax as other expressions.
View examples and expression functions in the Expressions area.
4.2.3 - Import Excel
Description
Import specific worksheets from Microsoft Excel files from PlaidCloud Document. Analyze supports the legacy Excel format (XP/2003) as well as the new format (2007/2010/2013). This includes, but is not limited to, the following file types:
- XLS
- XLSX
- XLSB
- XLSM
Examples
No examples yet...
Import Parameters
The file selector in this transform allows you to choose a file stored in a PlaidCloud Document location for import.
You can also choose a directory to import and all files within that directory will be imported as part of the transform run.
Source Account
Choose a PlaidCloud Document account for which you have access. This will provide you with the ability to select a directory or file in the next selection.
Search Option
The Search option allows for finding all matching files below a specified directory path to import. This can be particularly useful if many files need to be included but they are stored in nested directories or are mixed in with other files within the same directory which you do not want to import.
The search path selected is the starting directory to search under. The search process will look for all files within that directory as well as sub-directories that match the search conditions specified. Ensure the search criteria can be applied to the files within the sub-directories too.
The search can be applied using the following conditions:
- Exact: Match the search text exactly
- Starts With: Match any file that starts with the search text
- Contains: Match any file that contains the search text
- Ends With: Match any file that ends with the search text
Source FilePath
When a specific file or directory of files are required for import, picking the file or directory is a better option than using search.
To select the file or directory, simply use the browse button to pick the path for the Document account selected above.
Variable Substition
For both the search option and specific file/directory option, variables can be used with in the path, search text, and file names.
An example that uses the current_month variable to dynamically point to the correct file:
legal_entity/inputs/{current_month}/ledger_values.csv
Target Table
The target selection for imports is limited to tables only since views do not contain underlying data.
Dynamic Option
The Dynamic option allows specification of a table using text, including variables. This is useful when employing variable driven workflows where table and view references are relative to the variables specified.
An example that uses the current_month variable to dynamically point to target table:
legal_entity/inputs/{current_month}/ledger_values
Static Option
When a specific table is desired as the target for the import, leave the Dynamic box unchecked and select the target Table.
If the target Table does not exist, select the Create new table button to create the table in the desired location.
Table Explorer is always avaible with any table selection. Click on the Table Explorer button to the right of the table selection and a Table Explorer window will open.
Remove non-ASCII Characters Option
By selecting this option, the import will remove any content that is not ASCII. While PlaidCloud fully supports Unicode (UTF-8), real-world files can contain all sorts of encodings and stray characters that make them challenging to process.
If the content of the file is expected to be ASCII only, checking this box will help ensure the import process runs smoothly.
Delete Files After Import Option
This option will allow the import process to delete the file from the PlaidCloud Document account after a successful import has completed.
This can be useful if the import files are generated can be recreated from a system of record or there is no reason to retain the raw input files once they have been processed.
Header
Since Excel files may or may not contain headers, PlaidCloud provides a way to either use the headers, ignore headers, or use column order to determine the column alignment.
- No Header: The file contains no header. Use the source list in the Data Mapper to determine the column alignment
- Has Header - Use Header and Override Field List: The file has a header. Use the header names specified and ignore the source list in the Data Mapper.
- Has Header - Skip Header and Use Field List Instead: The file has a header but it should be ignored. Use the header names specified by the source list in the Data Mapper.
Row Selection
For input files with extraneous records, you can specify a number of rows to skip before processing the data. This is useful if files contain header blocks that must be skipped before arriving at the tabular data.
Worksheets to Import
Because workbooks may contain many worksheets with different data, it is possible to select which worksheets should be imported in the current import process. The options are:
- All Worksheets
- Worksheets Matching Search
- Selected Worksheets
Using Worksheet Search
The search functionality for worksheets allows inclusion of worksheets matching the search criteria. The search criteria allows for:
- Starts With: The worksheet name starts with the search text
- Contains: The worksheet name contains the search text
- Ends With: The worksheet name ends with the search text
Find Sheets in Selected File
The find sheets button will open the Excel file and list the worksheets available in the table. Mark the checkboxes in the table for the worksheets to be included in the import.
Table Data Selection
Data Mapper Configuration
The Data Mapper is used to map columns from the source data to the target data table.
Inspection and Populating the Mapper
Using the Inspect Source menu button provides additional ways to map columns from source to target:
- Populate Both Mapping Tables: Propagates all values from the source data table into the target data table. This is done by default.
- Populate Source Mapping Table Only: Maps all values in the source data table only. This is helpful when modifying an existing workflow when source column structure has changed.
- Populate Target Mapping Table Only: Propagates all values into the target data table only.
If the source and target column options aren’t enough, other columns can be added into the target data table in several different ways:
- Propagate All will insert all source columns into the target data table, whether they already existed or not.
- Propagate Selected will insert selected source column(s) only.
- Right click on target side and select Insert Row to insert a row immediately above the currently selected row.
- Right click on target side and select Append Row to insert a row at the bottom (far right) of the target data table.
Deleting Columns
To delete columns from the target data table, select the desired column(s), then right click and select Delete.
Chaging Column Order
To rearrange columns in the target data table, select the desired column(s). You can use either:
- Bulk Move Arrows: Select the desired move option from the arrows in the upper right
- Context Menu: Right clikc and select Move to Top, Move Up, Move Down, or Move to Bottom.
Reduce Result to Distinct Records Only
To return only distinct options, select the Distinct menu option. This will toggle a set of checkboxes for each column in the source. Simply check any box next to the corresponding column to return only distinct results.
Depending on the situation, you may want to consider use of Summarization instead.
The distinct process retains the first unique record found and discards the rest. You may want to apply a sort on the data if it is important for consistency between runs.
Aggregation and Grouping
To aggregate results, select the Summarize menu option. This will toggle a set of select boxes for each column in the target data table. Choose an appropriate summarization method for each column.
- Group By
- Sum
- Min
- Max
- First
- Last
- Count
- Count (including nulls)
- Mean
- Standard Deviation
- Sample Standard Deviation
- Population Standard Deviation
- Variance
- Sample Variance
- Population Variance
- Advanced Non-Group_By
For advanced data mapper usage such as expressions, cleaning, and constants, please see the Advanced Data Mapper Usage
Data Filters
To allow for maximum flexibility, data filters are available on the source data and the target data. For larger data sets, it can be especially beneficial to filter out rows on the source so the remaining operations are performed on a smaller data set.
Select Subset Of Data
This filter type provides a way to filter the inbound source data based on the specified conditions.
Apply Secondary Filter To Result Data
This filter type provides a way to apply a filter to the post-transformed result data based on the specified conditions. The ability to apply a filter on the post-transformed result allows for exclusions based on results of complex calcuations, summarizaitons, or window functions.
Final Data Table Slicing (Limit)
The row slicing capability provides the ability to limit the rows in the result set based on a range and starting point.
Filter Syntax
The filter syntax utilizes Python SQLAlchemy which is the same syntax as other expressions.
View examples and expression functions in the Expressions area.
4.2.4 - Import External Database Tables
Description
Includes ability to perform delta loads and map to alternate target table names.
Examples
No examples yet...
Unique Configuration Items
None
Common Configuration Items
Remove non-ASCII Characters Option
By selecting this option, the import will remove any content that is not ASCII. While PlaidCloud fully supports Unicode (UTF-8), real-world files can contain all sorts of encodings and stray characters that make them challenging to process.
If the content of the file is expected to be ASCII only, checking this box will help ensure the import process runs smoothly.
Delete Files After Import Option
This option will allow the import process to delete the file from the PlaidCloud Document account after a successful import has completed.
This can be useful if the import files are generated can be recreated from a system of record or there is no reason to retain the raw input files once they have been processed.
Import File Selector
The file selector in this transform allows you to choose a file stored in a PlaidCloud Document location for import.
You can also choose a directory to import and all files within that directory will be imported as part of the transform run.
Selecting a Document Account
Choose a PlaidCloud Document account for which you have access. This will provide you with the ability to select a directory or file in the next selection.
Search Option
The Search option allows for finding all matching files below a specified directory path to import. This can be particularly useful if many files need to be included but they are stored in nested directories or are mixed in with other files within the same directory which you do not want to import.
The search path selected is the starting directory to search under. The search process will look for all files within that directory as well as sub-directories that match the search conditions specified. Ensure the search criteria can be applied to the files within the sub-directories too.
The search can be applied using the following conditions:
- Exact: Match the search text exactly
- Starts With: Match any file that starts with the search text
- Contains: Match any file that contains the search text
- Ends With: Match any file that ends with the search text
File or Directory Selection Option
When a specific file or directory of files are required for import, picking the file or directory is a better option than using search.
To select the file or directory, simply use the browse button to pick the path for the Document account selected above.
Variable Substition
For both the search option and specific file/directory option, variables can be used with in the path, search text, and file names.
An example that uses the current_month variable to dynamically point to the correct file:
legal_entity/inputs/{current_month}/ledger_values.csv
Target Table
The target selection for imports is limited to tables only since views do not contain underlying data.
Dynamic Option
The Dynamic option allows specification of a table using text, including variables. This is useful when employing variable driven workflows where table and view references are relative to the variables specified.
An example that uses the current_month variable to dynamically point to target table:
legal_entity/inputs/{current_month}/ledger_values
Static Option
When a specific table is desired as the target for the import, leave the Dynamic box unchecked and select the target Table.
If the target Table does not exist, select the Create new table button to create the table in the desired location.
Table Explorer is always avaible with any table selection. Click on the Table Explorer button to the right of the table selection and a Table Explorer window will open.
Data Mapper Configuration
The Data Mapper is used to map columns from the source data to the target data table.
Inspection and Populating the Mapper
Using the Inspect Source menu button provides additional ways to map columns from source to target:
- Populate Both Mapping Tables: Propagates all values from the source data table into the target data table. This is done by default.
- Populate Source Mapping Table Only: Maps all values in the source data table only. This is helpful when modifying an existing workflow when source column structure has changed.
- Populate Target Mapping Table Only: Propagates all values into the target data table only.
If the source and target column options aren’t enough, other columns can be added into the target data table in several different ways:
- Propagate All will insert all source columns into the target data table, whether they already existed or not.
- Propagate Selected will insert selected source column(s) only.
- Right click on target side and select Insert Row to insert a row immediately above the currently selected row.
- Right click on target side and select Append Row to insert a row at the bottom (far right) of the target data table.
Deleting Columns
To delete columns from the target data table, select the desired column(s), then right click and select Delete.
Chaging Column Order
To rearrange columns in the target data table, select the desired column(s). You can use either:
- Bulk Move Arrows: Select the desired move option from the arrows in the upper right
- Context Menu: Right clikc and select Move to Top, Move Up, Move Down, or Move to Bottom.
Reduce Result to Distinct Records Only
To return only distinct options, select the Distinct menu option. This will toggle a set of checkboxes for each column in the source. Simply check any box next to the corresponding column to return only distinct results.
Depending on the situation, you may want to consider use of Summarization instead.
The distinct process retains the first unique record found and discards the rest. You may want to apply a sort on the data if it is important for consistency between runs.
Aggregation and Grouping
To aggregate results, select the Summarize menu option. This will toggle a set of select boxes for each column in the target data table. Choose an appropriate summarization method for each column.
- Group By
- Sum
- Min
- Max
- First
- Last
- Count
- Count (including nulls)
- Mean
- Standard Deviation
- Sample Standard Deviation
- Population Standard Deviation
- Variance
- Sample Variance
- Population Variance
- Advanced Non-Group_By
For advanced data mapper usage such as expressions, cleaning, and constants, please see the Advanced Data Mapper Usage
To allow for maximum flexibility, data filters are available on the source data and the target data. For larger data sets, it can be especially beneficial to filter out rows on the source so the remaining operations are performed on a smaller data set.
Select Subset Of Data
This filter type provides a way to filter the inbound source data based on the specified conditions.
Apply Secondary Filter To Result Data
This filter type provides a way to apply a filter to the post-transformed result data based on the specified conditions. The ability to apply a filter on the post-transformed result allows for exclusions based on results of complex calcuations, summarizaitons, or window functions.
Final Data Table Slicing (Limit)
The row slicing capability provides the ability to limit the rows in the result set based on a range and starting point.
Filter Syntax
The filter syntax utilizes Python SQLAlchemy which is the same syntax as other expressions.
View examples and expression functions in the Expressions area.
4.2.5 - Import Fixed Width
Description
Imports fixed-width files.
Examples
No examples yet…
Import Parameters
The file selector in this transform allows you to choose a file stored in a PlaidCloud Document location for import.
You can also choose a directory to import and all files within that directory will be imported as part of the transform run.
Source Account
Choose a PlaidCloud Document account for which you have access. This will provide you with the ability to select a directory or file in the next selection.
Search Option
The Search option allows for finding all matching files below a specified directory path to import. This can be particularly useful if many files need to be included but they are stored in nested directories or are mixed in with other files within the same directory which you do not want to import.
The search path selected is the starting directory to search under. The search process will look for all files within that directory as well as sub-directories that match the search conditions specified. Ensure the search criteria can be applied to the files within the sub-directories too.
The search can be applied using the following conditions:
- Exact: Match the search text exactly
- Starts With: Match any file that starts with the search text
- Contains: Match any file that contains the search text
- Ends With: Match any file that ends with the search text
Source FilePath
When a specific file or directory of files are required for import, picking the file or directory is a better option than using search.
To select the file or directory, simply use the browse button to pick the path for the Document account selected above.
Variable Substition
For both the search option and specific file/directory option, variables can be used with in the path, search text, and file names.
An example that uses the current_month variable to dynamically point to the correct file:
legal_entity/inputs/{current_month}/ledger_values.csv
Target Table
The target selection for imports is limited to tables only since views do not contain underlying data.
Dynamic Option
The Dynamic option allows specification of a table using text, including variables. This is useful when employing variable driven workflows where table and view references are relative to the variables specified.
An example that uses the current_month variable to dynamically point to target table:
legal_entity/inputs/{current_month}/ledger_values
Static Option
When a specific table is desired as the target for the import, leave the Dynamic box unchecked and select the target Table.
If the target Table does not exist, select the Create new table button to create the table in the desired location.
Table Explorer is always avaible with any table selection. Click on the Table Explorer button to the right of the table selection and a Table Explorer window will open.
Remove non-ASCII Characters Option
By selecting this option, the import will remove any content that is not ASCII. While PlaidCloud fully supports Unicode (UTF-8), real-world files can contain all sorts of encodings and stray characters that make them challenging to process.
If the content of the file is expected to be ASCII only, checking this box will help ensure the import process runs smoothly.
Delete Files After Import Option
This option will allow the import process to delete the file from the PlaidCloud Document account after a successful import has completed.
This can be useful if the import files are generated can be recreated from a system of record or there is no reason to retain the raw input files once they have been processed.
Header
Since Excel files may or may not contain headers, PlaidCloud provides a way to either use the headers, ignore headers, or use column order to determine the column alignment.
- No Header: The file contains no header. Use the source list in the Data Mapper to determine the column alignment
- Has Header - Use Header and Override Field List: The file has a header. Use the header names specified and ignore the source list in the Data Mapper.
- Has Header - Skip Header and Use Field List Instead: The file has a header but it should be ignored. Use the header names specified by the source list in the Data Mapper.
Row Selection
For input files with extraneous records, you can specify a number of rows to skip before processing the data. This is useful if files contain header blocks that must be skipped before arriving at the tabular data.
Column Widths
Enter the widths of the columns seperated with commas or spaces.
Table Data Selection
Data Mapper Configuration
The Data Mapper is used to map columns from the source data to the target data table.
Inspection and Populating the Mapper
Using the Inspect Source menu button provides additional ways to map columns from source to target:
- Populate Both Mapping Tables: Propagates all values from the source data table into the target data table. This is done by default.
- Populate Source Mapping Table Only: Maps all values in the source data table only. This is helpful when modifying an existing workflow when source column structure has changed.
- Populate Target Mapping Table Only: Propagates all values into the target data table only.
If the source and target column options aren’t enough, other columns can be added into the target data table in several different ways:
- Propagate All will insert all source columns into the target data table, whether they already existed or not.
- Propagate Selected will insert selected source column(s) only.
- Right click on target side and select Insert Row to insert a row immediately above the currently selected row.
- Right click on target side and select Append Row to insert a row at the bottom (far right) of the target data table.
Deleting Columns
To delete columns from the target data table, select the desired column(s), then right click and select Delete.
Chaging Column Order
To rearrange columns in the target data table, select the desired column(s). You can use either:
- Bulk Move Arrows: Select the desired move option from the arrows in the upper right
- Context Menu: Right clikc and select Move to Top, Move Up, Move Down, or Move to Bottom.
Reduce Result to Distinct Records Only
To return only distinct options, select the Distinct menu option. This will toggle a set of checkboxes for each column in the source. Simply check any box next to the corresponding column to return only distinct results.
Depending on the situation, you may want to consider use of Summarization instead.
The distinct process retains the first unique record found and discards the rest. You may want to apply a sort on the data if it is important for consistency between runs.
Aggregation and Grouping
To aggregate results, select the Summarize menu option. This will toggle a set of select boxes for each column in the target data table. Choose an appropriate summarization method for each column.
- Group By
- Sum
- Min
- Max
- First
- Last
- Count
- Count (including nulls)
- Mean
- Standard Deviation
- Sample Standard Deviation
- Population Standard Deviation
- Variance
- Sample Variance
- Population Variance
- Advanced Non-Group_By
For advanced data mapper usage such as expressions, cleaning, and constants, please see the Advanced Data Mapper Usage
Data Filters
To allow for maximum flexibility, data filters are available on the source data and the target data. For larger data sets, it can be especially beneficial to filter out rows on the source so the remaining operations are performed on a smaller data set.
Select Subset Of Data
This filter type provides a way to filter the inbound source data based on the specified conditions.
Apply Secondary Filter To Result Data
This filter type provides a way to apply a filter to the post-transformed result data based on the specified conditions. The ability to apply a filter on the post-transformed result allows for exclusions based on results of complex calcuations, summarizaitons, or window functions.
Final Data Table Slicing (Limit)
The row slicing capability provides the ability to limit the rows in the result set based on a range and starting point.
Filter Syntax
The filter syntax utilizes Python SQLAlchemy which is the same syntax as other expressions.
View examples and expression functions in the Expressions area.
4.2.6 - Import Google BigQuery
Description
Import Google BigQuery files.
Examples
No examples yet...
Unique Configuration Items
Coming soon...
Common Configuration Items
Remove non-ASCII Characters Option
By selecting this option, the import will remove any content that is not ASCII. While PlaidCloud fully supports Unicode (UTF-8), real-world files can contain all sorts of encodings and stray characters that make them challenging to process.
If the content of the file is expected to be ASCII only, checking this box will help ensure the import process runs smoothly.
Delete Files After Import Option
This option will allow the import process to delete the file from the PlaidCloud Document account after a successful import has completed.
This can be useful if the import files are generated can be recreated from a system of record or there is no reason to retain the raw input files once they have been processed.
Import File Selector
The file selector in this transform allows you to choose a file stored in a PlaidCloud Document location for import.
You can also choose a directory to import and all files within that directory will be imported as part of the transform run.
Selecting a Document Account
Choose a PlaidCloud Document account for which you have access. This will provide you with the ability to select a directory or file in the next selection.
Search Option
The Search option allows for finding all matching files below a specified directory path to import. This can be particularly useful if many files need to be included but they are stored in nested directories or are mixed in with other files within the same directory which you do not want to import.
The search path selected is the starting directory to search under. The search process will look for all files within that directory as well as sub-directories that match the search conditions specified. Ensure the search criteria can be applied to the files within the sub-directories too.
The search can be applied using the following conditions:
- Exact: Match the search text exactly
- Starts With: Match any file that starts with the search text
- Contains: Match any file that contains the search text
- Ends With: Match any file that ends with the search text
File or Directory Selection Option
When a specific file or directory of files are required for import, picking the file or directory is a better option than using search.
To select the file or directory, simply use the browse button to pick the path for the Document account selected above.
Variable Substition
For both the search option and specific file/directory option, variables can be used with in the path, search text, and file names.
An example that uses the current_month variable to dynamically point to the correct file:
legal_entity/inputs/{current_month}/ledger_values.csv
Target Table
The target selection for imports is limited to tables only since views do not contain underlying data.
Dynamic Option
The Dynamic option allows specification of a table using text, including variables. This is useful when employing variable driven workflows where table and view references are relative to the variables specified.
An example that uses the current_month variable to dynamically point to target table:
legal_entity/inputs/{current_month}/ledger_values
Static Option
When a specific table is desired as the target for the import, leave the Dynamic box unchecked and select the target Table.
If the target Table does not exist, select the Create new table button to create the table in the desired location.
Table Explorer is always avaible with any table selection. Click on the Table Explorer button to the right of the table selection and a Table Explorer window will open.
Data Mapper Configuration
The Data Mapper is used to map columns from the source data to the target data table.
Inspection and Populating the Mapper
Using the Inspect Source menu button provides additional ways to map columns from source to target:
- Populate Both Mapping Tables: Propagates all values from the source data table into the target data table. This is done by default.
- Populate Source Mapping Table Only: Maps all values in the source data table only. This is helpful when modifying an existing workflow when source column structure has changed.
- Populate Target Mapping Table Only: Propagates all values into the target data table only.
If the source and target column options aren’t enough, other columns can be added into the target data table in several different ways:
- Propagate All will insert all source columns into the target data table, whether they already existed or not.
- Propagate Selected will insert selected source column(s) only.
- Right click on target side and select Insert Row to insert a row immediately above the currently selected row.
- Right click on target side and select Append Row to insert a row at the bottom (far right) of the target data table.
Deleting Columns
To delete columns from the target data table, select the desired column(s), then right click and select Delete.
Chaging Column Order
To rearrange columns in the target data table, select the desired column(s). You can use either:
- Bulk Move Arrows: Select the desired move option from the arrows in the upper right
- Context Menu: Right clikc and select Move to Top, Move Up, Move Down, or Move to Bottom.
Reduce Result to Distinct Records Only
To return only distinct options, select the Distinct menu option. This will toggle a set of checkboxes for each column in the source. Simply check any box next to the corresponding column to return only distinct results.
Depending on the situation, you may want to consider use of Summarization instead.
The distinct process retains the first unique record found and discards the rest. You may want to apply a sort on the data if it is important for consistency between runs.
Aggregation and Grouping
To aggregate results, select the Summarize menu option. This will toggle a set of select boxes for each column in the target data table. Choose an appropriate summarization method for each column.
- Group By
- Sum
- Min
- Max
- First
- Last
- Count
- Count (including nulls)
- Mean
- Standard Deviation
- Sample Standard Deviation
- Population Standard Deviation
- Variance
- Sample Variance
- Population Variance
- Advanced Non-Group_By
For advanced data mapper usage such as expressions, cleaning, and constants, please see the Advanced Data Mapper Usage
To allow for maximum flexibility, data filters are available on the source data and the target data. For larger data sets, it can be especially beneficial to filter out rows on the source so the remaining operations are performed on a smaller data set.
Select Subset Of Data
This filter type provides a way to filter the inbound source data based on the specified conditions.
Apply Secondary Filter To Result Data
This filter type provides a way to apply a filter to the post-transformed result data based on the specified conditions. The ability to apply a filter on the post-transformed result allows for exclusions based on results of complex calcuations, summarizaitons, or window functions.
Final Data Table Slicing (Limit)
The row slicing capability provides the ability to limit the rows in the result set based on a range and starting point.
Filter Syntax
The filter syntax utilizes Python SQLAlchemy which is the same syntax as other expressions.
View examples and expression functions in the Expressions area.
4.2.7 - Import Google Spreadsheet
Description
Import specific worksheets from Google Spreadsheet files.
Examples
No examples yet...
Import Parameters
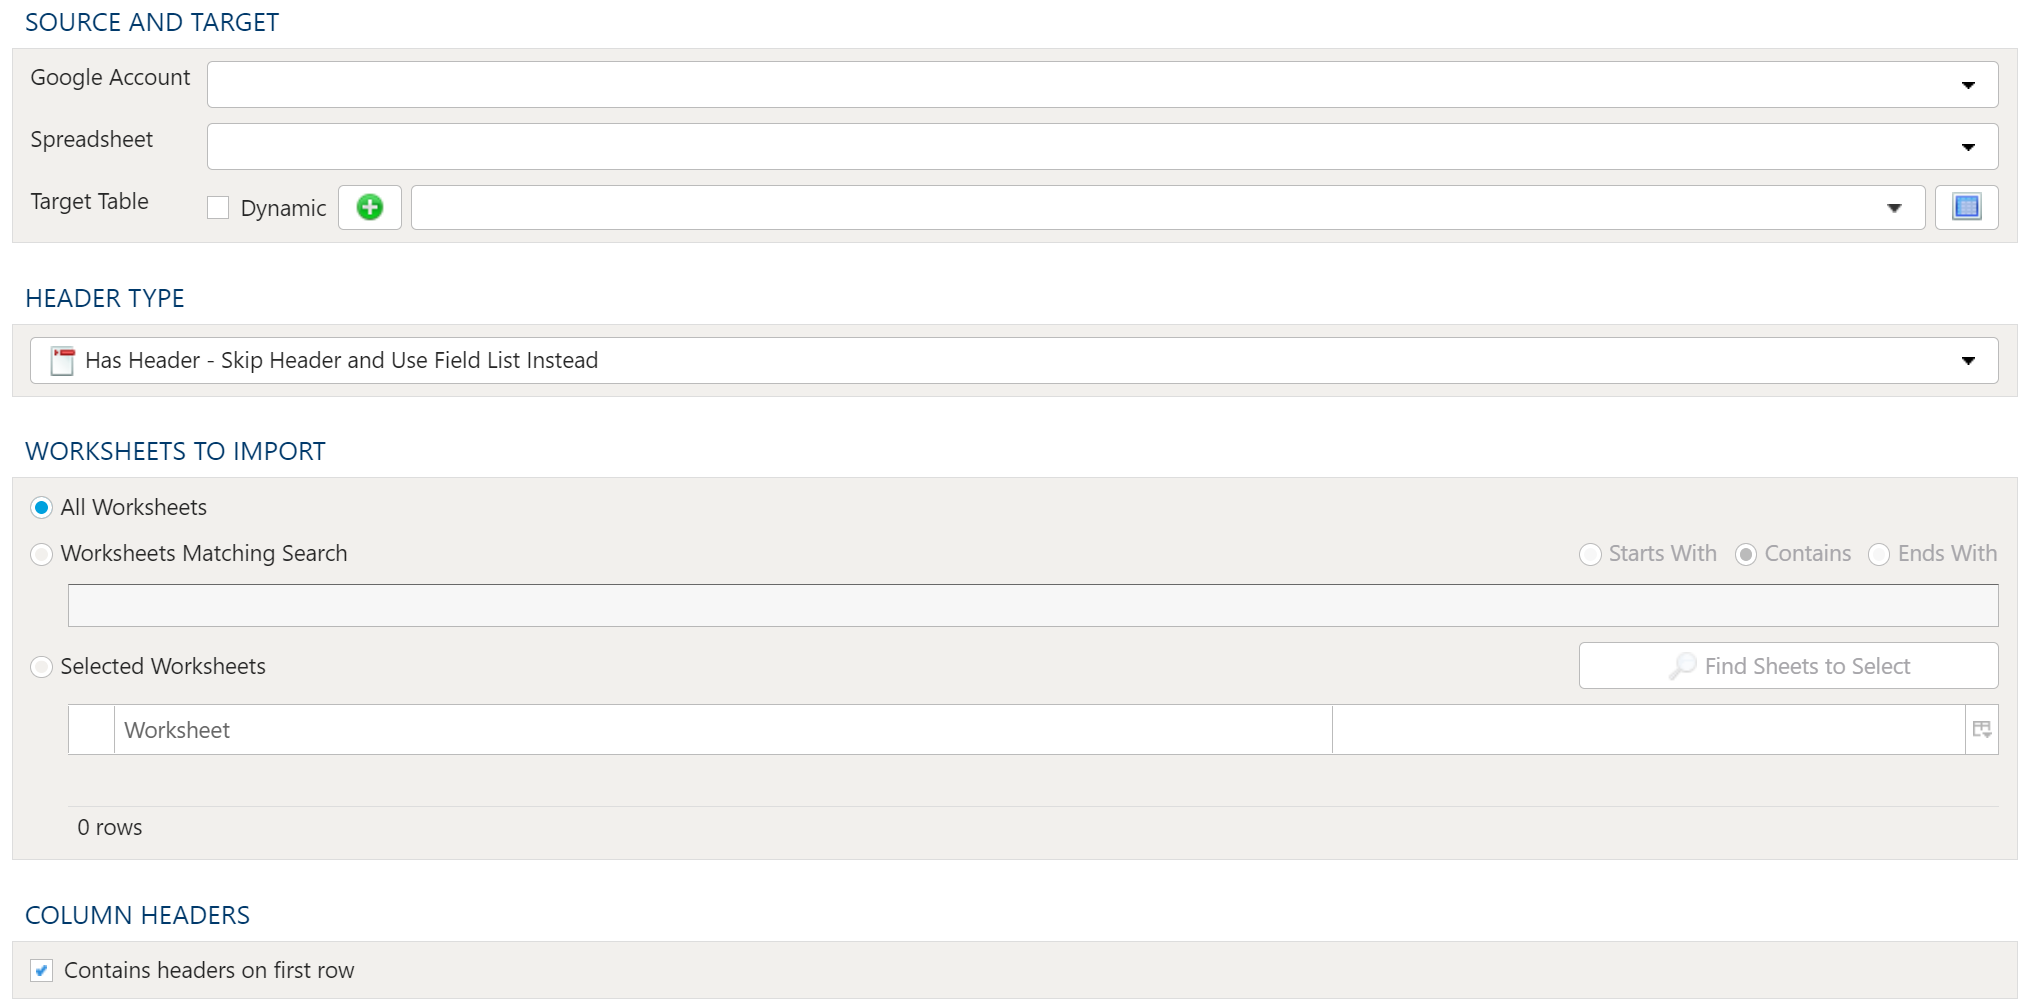
Source And Target
Google Account
Accessing Google Spreadsheet data requires a valid Google user account. This requires set up in Tools. For details on setting up a Google account connection, see here: PlaidCloud Tools – Connection.
Once all necessary accounts have been set up, select the appropriate Google Account from the drop down list.
Spreadsheet
Next, specify the Spreadsheet to import from the dropdown menu containing all available files associated with the specified Google Account.
Target Table
The target selection for imports is limited to tables only since views do not contain underlying data.
Dynamic Option
The Dynamic option allows specification of a table using text, including variables. This is useful when employing variable driven workflows where table and view references are relative to the variables specified.
An example that uses the current_month variable to dynamically point to target table:
legal_entity/inputs/{current_month}/ledger_values
Static Option
When a specific table is desired as the target for the import, leave the Dynamic box unchecked and select the target Table.
If the target Table does not exist, select the Create new table button to create the table in the desired location.
Table Explorer is always avaible with any table selection. Click on the Table Explorer button to the right of the table selection and a Table Explorer window will open.
Header Type
Since Google Spreadsheets may or may not contain headers, PlaidCloud provides a way to either use the headers, ignore headers, or use column order to determine the column alignment.
- No Header: The file contains no header. Use the source list in the Data Mapper to determine the column alignment
- Has Header - Use Header and Override Field List: The file has a header. Use the header names specified and ignore the source list in the Data Mapper.
- Has Header - Skip Header and Use Field List Instead: The file has a header but it should be ignored. Use the header names specified by the source list in the Data Mapper.
Worksheets to Import
Because workbooks may contain many worksheets with different data, it is possible to select which worksheets should be imported in the current import process. The options are:
- All Worksheets
- Worksheets Matching Search
- Selected Worksheets
Using Worksheet Search
The search functionality for worksheets allows inclusion of worksheets matching the search criteria. The search criteria allows for:
- Starts With: The worksheet name starts with the search text
- Contains: The worksheet name contains the search text
- Ends With: The worksheet name ends with the search text
Find Sheets in Selected File
The find sheets button will open the Excel file and list the worksheets available in the table. Mark the checkboxes in the table for the worksheets to be included in the import.
Column Headers
Table Data Selection
Data Mapper Configuration
The Data Mapper is used to map columns from the source data to the target data table.
Inspection and Populating the Mapper
Using the Inspect Source menu button provides additional ways to map columns from source to target:
- Populate Both Mapping Tables: Propagates all values from the source data table into the target data table. This is done by default.
- Populate Source Mapping Table Only: Maps all values in the source data table only. This is helpful when modifying an existing workflow when source column structure has changed.
- Populate Target Mapping Table Only: Propagates all values into the target data table only.
If the source and target column options aren’t enough, other columns can be added into the target data table in several different ways:
- Propagate All will insert all source columns into the target data table, whether they already existed or not.
- Propagate Selected will insert selected source column(s) only.
- Right click on target side and select Insert Row to insert a row immediately above the currently selected row.
- Right click on target side and select Append Row to insert a row at the bottom (far right) of the target data table.
Deleting Columns
To delete columns from the target data table, select the desired column(s), then right click and select Delete.
Chaging Column Order
To rearrange columns in the target data table, select the desired column(s). You can use either:
- Bulk Move Arrows: Select the desired move option from the arrows in the upper right
- Context Menu: Right clikc and select Move to Top, Move Up, Move Down, or Move to Bottom.
Reduce Result to Distinct Records Only
To return only distinct options, select the Distinct menu option. This will toggle a set of checkboxes for each column in the source. Simply check any box next to the corresponding column to return only distinct results.
Depending on the situation, you may want to consider use of Summarization instead.
The distinct process retains the first unique record found and discards the rest. You may want to apply a sort on the data if it is important for consistency between runs.
Aggregation and Grouping
To aggregate results, select the Summarize menu option. This will toggle a set of select boxes for each column in the target data table. Choose an appropriate summarization method for each column.
- Group By
- Sum
- Min
- Max
- First
- Last
- Count
- Count (including nulls)
- Mean
- Standard Deviation
- Sample Standard Deviation
- Population Standard Deviation
- Variance
- Sample Variance
- Population Variance
- Advanced Non-Group_By
For advanced data mapper usage such as expressions, cleaning, and constants, please see the Advanced Data Mapper Usage
Data Filters
To allow for maximum flexibility, data filters are available on the source data and the target data. For larger data sets, it can be especially beneficial to filter out rows on the source so the remaining operations are performed on a smaller data set.
Select Subset Of Data
This filter type provides a way to filter the inbound source data based on the specified conditions.
Apply Secondary Filter To Result Data
This filter type provides a way to apply a filter to the post-transformed result data based on the specified conditions. The ability to apply a filter on the post-transformed result allows for exclusions based on results of complex calcuations, summarizaitons, or window functions.
Final Data Table Slicing (Limit)
The row slicing capability provides the ability to limit the rows in the result set based on a range and starting point.
Filter Syntax
The filter syntax utilizes Python SQLAlchemy which is the same syntax as other expressions.
View examples and expression functions in the Expressions area.
4.2.8 - Import HDF
Description
Import HDF5 files from PlaidCloud Document.
For more details on HDF5 files, see the HDF Group’s official website here: http://www.hdfgroup.org/HDF5/.
Examples
No examples yet...
Unique Configuration Items
Key Name
HDF files store data in a path structure. A key (path) is needed as the destination for the table within the HDF file. In most situations, this will be table.
Common Configuration Items
Remove non-ASCII Characters Option
By selecting this option, the import will remove any content that is not ASCII. While PlaidCloud fully supports Unicode (UTF-8), real-world files can contain all sorts of encodings and stray characters that make them challenging to process.
If the content of the file is expected to be ASCII only, checking this box will help ensure the import process runs smoothly.
Delete Files After Import Option
This option will allow the import process to delete the file from the PlaidCloud Document account after a successful import has completed.
This can be useful if the import files are generated can be recreated from a system of record or there is no reason to retain the raw input files once they have been processed.
Import File Selector
The file selector in this transform allows you to choose a file stored in a PlaidCloud Document location for import.
You can also choose a directory to import and all files within that directory will be imported as part of the transform run.
Selecting a Document Account
Choose a PlaidCloud Document account for which you have access. This will provide you with the ability to select a directory or file in the next selection.
Search Option
The Search option allows for finding all matching files below a specified directory path to import. This can be particularly useful if many files need to be included but they are stored in nested directories or are mixed in with other files within the same directory which you do not want to import.
The search path selected is the starting directory to search under. The search process will look for all files within that directory as well as sub-directories that match the search conditions specified. Ensure the search criteria can be applied to the files within the sub-directories too.
The search can be applied using the following conditions:
- Exact: Match the search text exactly
- Starts With: Match any file that starts with the search text
- Contains: Match any file that contains the search text
- Ends With: Match any file that ends with the search text
File or Directory Selection Option
When a specific file or directory of files are required for import, picking the file or directory is a better option than using search.
To select the file or directory, simply use the browse button to pick the path for the Document account selected above.
Variable Substition
For both the search option and specific file/directory option, variables can be used with in the path, search text, and file names.
An example that uses the current_month variable to dynamically point to the correct file:
legal_entity/inputs/{current_month}/ledger_values.csv
Target Table
The target selection for imports is limited to tables only since views do not contain underlying data.
Dynamic Option
The Dynamic option allows specification of a table using text, including variables. This is useful when employing variable driven workflows where table and view references are relative to the variables specified.
An example that uses the current_month variable to dynamically point to target table:
legal_entity/inputs/{current_month}/ledger_values
Static Option
When a specific table is desired as the target for the import, leave the Dynamic box unchecked and select the target Table.
If the target Table does not exist, select the Create new table button to create the table in the desired location.
Table Explorer is always avaible with any table selection. Click on the Table Explorer button to the right of the table selection and a Table Explorer window will open.
Data Mapper Configuration
The Data Mapper is used to map columns from the source data to the target data table.
Inspection and Populating the Mapper
Using the Inspect Source menu button provides additional ways to map columns from source to target:
- Populate Both Mapping Tables: Propagates all values from the source data table into the target data table. This is done by default.
- Populate Source Mapping Table Only: Maps all values in the source data table only. This is helpful when modifying an existing workflow when source column structure has changed.
- Populate Target Mapping Table Only: Propagates all values into the target data table only.
If the source and target column options aren’t enough, other columns can be added into the target data table in several different ways:
- Propagate All will insert all source columns into the target data table, whether they already existed or not.
- Propagate Selected will insert selected source column(s) only.
- Right click on target side and select Insert Row to insert a row immediately above the currently selected row.
- Right click on target side and select Append Row to insert a row at the bottom (far right) of the target data table.
Deleting Columns
To delete columns from the target data table, select the desired column(s), then right click and select Delete.
Chaging Column Order
To rearrange columns in the target data table, select the desired column(s). You can use either:
- Bulk Move Arrows: Select the desired move option from the arrows in the upper right
- Context Menu: Right clikc and select Move to Top, Move Up, Move Down, or Move to Bottom.
Reduce Result to Distinct Records Only
To return only distinct options, select the Distinct menu option. This will toggle a set of checkboxes for each column in the source. Simply check any box next to the corresponding column to return only distinct results.
Depending on the situation, you may want to consider use of Summarization instead.
The distinct process retains the first unique record found and discards the rest. You may want to apply a sort on the data if it is important for consistency between runs.
Aggregation and Grouping
To aggregate results, select the Summarize menu option. This will toggle a set of select boxes for each column in the target data table. Choose an appropriate summarization method for each column.
- Group By
- Sum
- Min
- Max
- First
- Last
- Count
- Count (including nulls)
- Mean
- Standard Deviation
- Sample Standard Deviation
- Population Standard Deviation
- Variance
- Sample Variance
- Population Variance
- Advanced Non-Group_By
For advanced data mapper usage such as expressions, cleaning, and constants, please see the Advanced Data Mapper Usage
To allow for maximum flexibility, data filters are available on the source data and the target data. For larger data sets, it can be especially beneficial to filter out rows on the source so the remaining operations are performed on a smaller data set.
Select Subset Of Data
This filter type provides a way to filter the inbound source data based on the specified conditions.
Apply Secondary Filter To Result Data
This filter type provides a way to apply a filter to the post-transformed result data based on the specified conditions. The ability to apply a filter on the post-transformed result allows for exclusions based on results of complex calcuations, summarizaitons, or window functions.
Final Data Table Slicing (Limit)
The row slicing capability provides the ability to limit the rows in the result set based on a range and starting point.
Filter Syntax
The filter syntax utilizes Python SQLAlchemy which is the same syntax as other expressions.
View examples and expression functions in the Expressions area.
4.2.9 - Import HTML
Description
Import HTML table data from the internet.
Examples
No examples yet...
Unique Configuration Items
Select Tables in HTML
Since it is possible to have multiple tables on a web page, the user must specify which table to import. To do so, specify Name and/or Attribute values to match.
For example, consider the following table:
<table border="1" id="import"> <tr> <th>Hello</th><th>World</th> </tr> <tr> <td>1</td><td>2</td> </tr> <tr> <td>3</td><td>4</td> </tr> </table>
To import this table, specify id:import in the Name Match field.
Additionally, there is an option to skip rows at the beginning of the table.
Column Headers
Specify the row to use for header information. By default, the Column Header Row is 0.
Common Configuration Items
Remove non-ASCII Characters Option
By selecting this option, the import will remove any content that is not ASCII. While PlaidCloud fully supports Unicode (UTF-8), real-world files can contain all sorts of encodings and stray characters that make them challenging to process.
If the content of the file is expected to be ASCII only, checking this box will help ensure the import process runs smoothly.
Delete Files After Import Option
This option will allow the import process to delete the file from the PlaidCloud Document account after a successful import has completed.
This can be useful if the import files are generated can be recreated from a system of record or there is no reason to retain the raw input files once they have been processed.
Import File Selector
The file selector in this transform allows you to choose a file stored in a PlaidCloud Document location for import.
You can also choose a directory to import and all files within that directory will be imported as part of the transform run.
Selecting a Document Account
Choose a PlaidCloud Document account for which you have access. This will provide you with the ability to select a directory or file in the next selection.
Search Option
The Search option allows for finding all matching files below a specified directory path to import. This can be particularly useful if many files need to be included but they are stored in nested directories or are mixed in with other files within the same directory which you do not want to import.
The search path selected is the starting directory to search under. The search process will look for all files within that directory as well as sub-directories that match the search conditions specified. Ensure the search criteria can be applied to the files within the sub-directories too.
The search can be applied using the following conditions:
- Exact: Match the search text exactly
- Starts With: Match any file that starts with the search text
- Contains: Match any file that contains the search text
- Ends With: Match any file that ends with the search text
File or Directory Selection Option
When a specific file or directory of files are required for import, picking the file or directory is a better option than using search.
To select the file or directory, simply use the browse button to pick the path for the Document account selected above.
Variable Substition
For both the search option and specific file/directory option, variables can be used with in the path, search text, and file names.
An example that uses the current_month variable to dynamically point to the correct file:
legal_entity/inputs/{current_month}/ledger_values.csv
Target Table
The target selection for imports is limited to tables only since views do not contain underlying data.
Dynamic Option
The Dynamic option allows specification of a table using text, including variables. This is useful when employing variable driven workflows where table and view references are relative to the variables specified.
An example that uses the current_month variable to dynamically point to target table:
legal_entity/inputs/{current_month}/ledger_values
Static Option
When a specific table is desired as the target for the import, leave the Dynamic box unchecked and select the target Table.
If the target Table does not exist, select the Create new table button to create the table in the desired location.
Table Explorer is always avaible with any table selection. Click on the Table Explorer button to the right of the table selection and a Table Explorer window will open.
Data Mapper Configuration
The Data Mapper is used to map columns from the source data to the target data table.
Inspection and Populating the Mapper
Using the Inspect Source menu button provides additional ways to map columns from source to target:
- Populate Both Mapping Tables: Propagates all values from the source data table into the target data table. This is done by default.
- Populate Source Mapping Table Only: Maps all values in the source data table only. This is helpful when modifying an existing workflow when source column structure has changed.
- Populate Target Mapping Table Only: Propagates all values into the target data table only.
If the source and target column options aren’t enough, other columns can be added into the target data table in several different ways:
- Propagate All will insert all source columns into the target data table, whether they already existed or not.
- Propagate Selected will insert selected source column(s) only.
- Right click on target side and select Insert Row to insert a row immediately above the currently selected row.
- Right click on target side and select Append Row to insert a row at the bottom (far right) of the target data table.
Deleting Columns
To delete columns from the target data table, select the desired column(s), then right click and select Delete.
Chaging Column Order
To rearrange columns in the target data table, select the desired column(s). You can use either:
- Bulk Move Arrows: Select the desired move option from the arrows in the upper right
- Context Menu: Right clikc and select Move to Top, Move Up, Move Down, or Move to Bottom.
Reduce Result to Distinct Records Only
To return only distinct options, select the Distinct menu option. This will toggle a set of checkboxes for each column in the source. Simply check any box next to the corresponding column to return only distinct results.
Depending on the situation, you may want to consider use of Summarization instead.
The distinct process retains the first unique record found and discards the rest. You may want to apply a sort on the data if it is important for consistency between runs.
Aggregation and Grouping
To aggregate results, select the Summarize menu option. This will toggle a set of select boxes for each column in the target data table. Choose an appropriate summarization method for each column.
- Group By
- Sum
- Min
- Max
- First
- Last
- Count
- Count (including nulls)
- Mean
- Standard Deviation
- Sample Standard Deviation
- Population Standard Deviation
- Variance
- Sample Variance
- Population Variance
- Advanced Non-Group_By
For advanced data mapper usage such as expressions, cleaning, and constants, please see the Advanced Data Mapper Usage
To allow for maximum flexibility, data filters are available on the source data and the target data. For larger data sets, it can be especially beneficial to filter out rows on the source so the remaining operations are performed on a smaller data set.
Select Subset Of Data
This filter type provides a way to filter the inbound source data based on the specified conditions.
Apply Secondary Filter To Result Data
This filter type provides a way to apply a filter to the post-transformed result data based on the specified conditions. The ability to apply a filter on the post-transformed result allows for exclusions based on results of complex calcuations, summarizaitons, or window functions.
Final Data Table Slicing (Limit)
The row slicing capability provides the ability to limit the rows in the result set based on a range and starting point.
Filter Syntax
The filter syntax utilizes Python SQLAlchemy which is the same syntax as other expressions.
View examples and expression functions in the Expressions area.
4.2.10 - Import JSON
Description
Import JSON text files from PlaidCloud Document.
For more details on JSON files, see the JSON official website here: http://json.org/.
JSON files do not retain column order. The column order in the source file does not necessarily reflect the column order in the imported data table.
Examples
No examples yet...
Unique Configuration Items
JSON Data Orientation
Consider the following data set:
| ID | Name | Gender | State | | 1 | Jack | M | MO | | 2 | Jill | F | MO | | 3 | George | M | VA | | 4 | Abe | M | KY |
JSON files can be imported from one of three data formats:
- Records: Data is stored in Python dictionary sets, with each row stored in {Column -> Value, …} format. For example:
[{ "ID": 1, "Name": "Jack", "Gender": "M", "State": "MO" }, { "ID": 2, "Name": "Jill", "Gender": "F", "State": "MO" }, { "ID": 3, "Name": "George", "Gender": "M", "State": "VA" }, { "ID": 4, "Name": "Abe", "Gender": "M", "State": "KY" }]
- Index: Data is stored in nested Python dictionary sets, with each row stored in {Index -> {Column -> Value, …},…} format. For example:
{ "0": { "ID": 1, "Name": "Jack", "Gender": "M", "State": "MO" }, "1": { "ID": 2, "Name": "Jill", "Gender": "F", "State": "MO" }, "2": { "ID": 3, "Name": "George", "Gender": "M", "State": "VA" }, "3": { "ID": 4, "Name": "Abe", "Gender": "M", "State": "KY" } }
- Split: Data is stored in a single Python dictionary set, values stored in lists. For example:
{ "columns": ["ID", "Name", "Gender", "State"], "index": [0, 1, 2, 3], "data": [ [1, "Jack", "M", "MO"], [2, "Jill", "F", "MO"], [3, "George", "M", "VA"], [4, "Abe", "M", "KY"] ] }
Common Configuration Items
Remove non-ASCII Characters Option
By selecting this option, the import will remove any content that is not ASCII. While PlaidCloud fully supports Unicode (UTF-8), real-world files can contain all sorts of encodings and stray characters that make them challenging to process.
If the content of the file is expected to be ASCII only, checking this box will help ensure the import process runs smoothly.
Delete Files After Import Option
This option will allow the import process to delete the file from the PlaidCloud Document account after a successful import has completed.
This can be useful if the import files are generated can be recreated from a system of record or there is no reason to retain the raw input files once they have been processed.
Import File Selector
The file selector in this transform allows you to choose a file stored in a PlaidCloud Document location for import.
You can also choose a directory to import and all files within that directory will be imported as part of the transform run.
Selecting a Document Account
Choose a PlaidCloud Document account for which you have access. This will provide you with the ability to select a directory or file in the next selection.
Search Option
The Search option allows for finding all matching files below a specified directory path to import. This can be particularly useful if many files need to be included but they are stored in nested directories or are mixed in with other files within the same directory which you do not want to import.
The search path selected is the starting directory to search under. The search process will look for all files within that directory as well as sub-directories that match the search conditions specified. Ensure the search criteria can be applied to the files within the sub-directories too.
The search can be applied using the following conditions:
- Exact: Match the search text exactly
- Starts With: Match any file that starts with the search text
- Contains: Match any file that contains the search text
- Ends With: Match any file that ends with the search text
File or Directory Selection Option
When a specific file or directory of files are required for import, picking the file or directory is a better option than using search.
To select the file or directory, simply use the browse button to pick the path for the Document account selected above.
Variable Substition
For both the search option and specific file/directory option, variables can be used with in the path, search text, and file names.
An example that uses the current_month variable to dynamically point to the correct file:
legal_entity/inputs/{current_month}/ledger_values.csv
Target Table
The target selection for imports is limited to tables only since views do not contain underlying data.
Dynamic Option
The Dynamic option allows specification of a table using text, including variables. This is useful when employing variable driven workflows where table and view references are relative to the variables specified.
An example that uses the current_month variable to dynamically point to target table:
legal_entity/inputs/{current_month}/ledger_values
Static Option
When a specific table is desired as the target for the import, leave the Dynamic box unchecked and select the target Table.
If the target Table does not exist, select the Create new table button to create the table in the desired location.
Table Explorer is always avaible with any table selection. Click on the Table Explorer button to the right of the table selection and a Table Explorer window will open.
Data Mapper Configuration
The Data Mapper is used to map columns from the source data to the target data table.
Inspection and Populating the Mapper
Using the Inspect Source menu button provides additional ways to map columns from source to target:
- Populate Both Mapping Tables: Propagates all values from the source data table into the target data table. This is done by default.
- Populate Source Mapping Table Only: Maps all values in the source data table only. This is helpful when modifying an existing workflow when source column structure has changed.
- Populate Target Mapping Table Only: Propagates all values into the target data table only.
If the source and target column options aren’t enough, other columns can be added into the target data table in several different ways:
- Propagate All will insert all source columns into the target data table, whether they already existed or not.
- Propagate Selected will insert selected source column(s) only.
- Right click on target side and select Insert Row to insert a row immediately above the currently selected row.
- Right click on target side and select Append Row to insert a row at the bottom (far right) of the target data table.
Deleting Columns
To delete columns from the target data table, select the desired column(s), then right click and select Delete.
Chaging Column Order
To rearrange columns in the target data table, select the desired column(s). You can use either:
- Bulk Move Arrows: Select the desired move option from the arrows in the upper right
- Context Menu: Right clikc and select Move to Top, Move Up, Move Down, or Move to Bottom.
Reduce Result to Distinct Records Only
To return only distinct options, select the Distinct menu option. This will toggle a set of checkboxes for each column in the source. Simply check any box next to the corresponding column to return only distinct results.
Depending on the situation, you may want to consider use of Summarization instead.
The distinct process retains the first unique record found and discards the rest. You may want to apply a sort on the data if it is important for consistency between runs.
Aggregation and Grouping
To aggregate results, select the Summarize menu option. This will toggle a set of select boxes for each column in the target data table. Choose an appropriate summarization method for each column.
- Group By
- Sum
- Min
- Max
- First
- Last
- Count
- Count (including nulls)
- Mean
- Standard Deviation
- Sample Standard Deviation
- Population Standard Deviation
- Variance
- Sample Variance
- Population Variance
- Advanced Non-Group_By
For advanced data mapper usage such as expressions, cleaning, and constants, please see the Advanced Data Mapper Usage
To allow for maximum flexibility, data filters are available on the source data and the target data. For larger data sets, it can be especially beneficial to filter out rows on the source so the remaining operations are performed on a smaller data set.
Select Subset Of Data
This filter type provides a way to filter the inbound source data based on the specified conditions.
Apply Secondary Filter To Result Data
This filter type provides a way to apply a filter to the post-transformed result data based on the specified conditions. The ability to apply a filter on the post-transformed result allows for exclusions based on results of complex calcuations, summarizaitons, or window functions.
Final Data Table Slicing (Limit)
The row slicing capability provides the ability to limit the rows in the result set based on a range and starting point.
Filter Syntax
The filter syntax utilizes Python SQLAlchemy which is the same syntax as other expressions.
View examples and expression functions in the Expressions area.
4.2.11 - Import Project Table
Description
Import table data from a different project.
Data Sharing Management
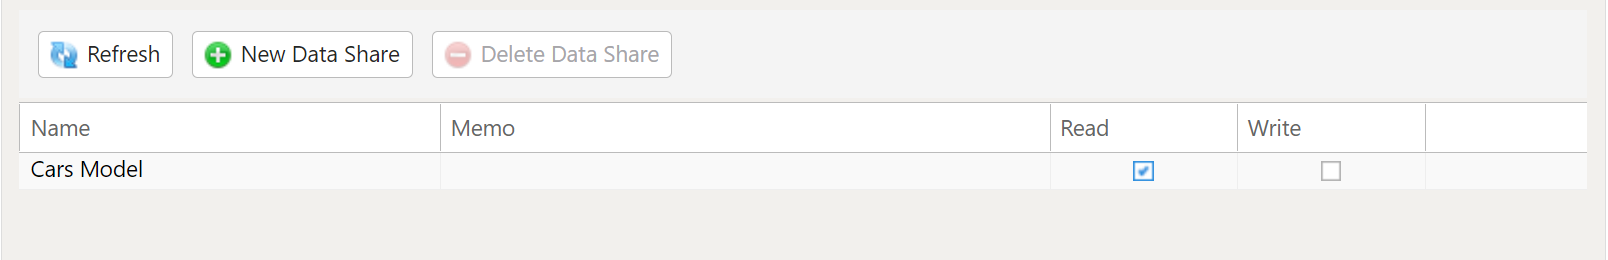
In order to import a table from another project you must first go to both projects Home Tab and allow the projects to share data with each other. To do this select New Data Share and select the project and give them Read access.
Import External Project Table
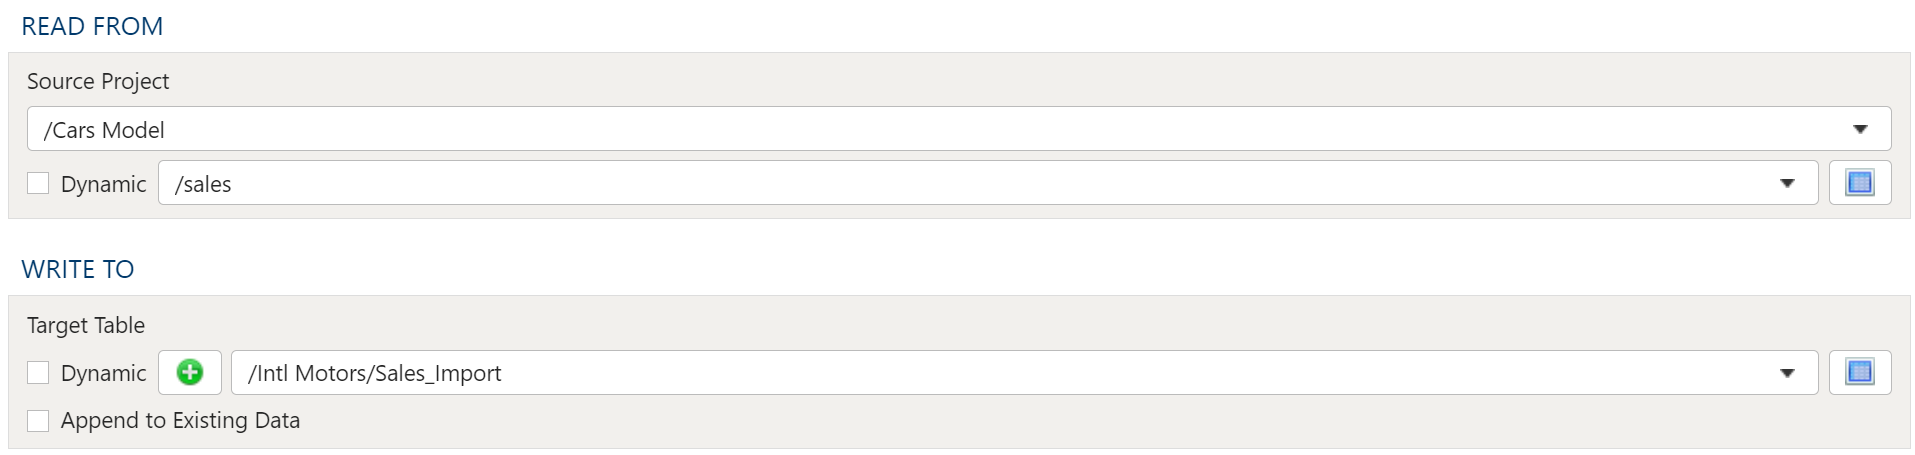
Read From
Select the Source Project and Source Table from the drop downs.
Write To
Target Table
The target selection for imports is limited to tables only since views do not contain underlying data.
Dynamic Option
The Dynamic option allows specification of a table using text, including variables. This is useful when employing variable driven workflows where table and view references are relative to the variables specified.
An example that uses the current_month variable to dynamically point to target table:
legal_entity/inputs/{current_month}/ledger_values
Static Option
When a specific table is desired as the target for the import, leave the Dynamic box unchecked and select the target Table.
If the target Table does not exist, select the Create new table button to create the table in the desired location.
Table Explorer is always avaible with any table selection. Click on the Table Explorer button to the right of the table selection and a Table Explorer window will open.
4.2.12 - Import Quandl
Description
Imports data sets from Quandl’s repository of millions of data sets.
For more details on Quandl data sets, see the Quandl official website here: http://www.quandl.com/.
Examples
No examples yet...
Unique Configuration Items
Source Data Specification
Accessing Quandl data sets requires a user account or a guest account with limited access. This requires set up in Tools. For details on setting up a Quandl account connection, see here: PlaidCloud Tools – Connection.
Once all necessary accounts have been set up, select the appropriate account from the drop down list.
Next, enter criteria for the desired Quandl code. Users can use the Search functionality to search for data sets. Alternatively, data sets can be entered manually. This requires the user to enter the portion of the URL after “http://www.quandl.com”.
For example, to import the data set for Microsoft stock, which can be found here (http://www.quandl.com/GOOG/NASDAQ_MSFT), enter GOOG/NASDAQ_MSFT in the Quandl Code field.
Data Selection
It is possible to slice Quandl data sets upon import. Available options include the following:
- Start Date: Use the date picker to select the desired date.
- End Date: Use the date picker to select the desired date.
- Collapse: Aggregate results on a daily, weekly, monthly, quarterly, or annual basis. There is no aggregation by default.
- Transformation: Summary calculations.
- Limit Rows: The default value of 0 returns all rows. Any other positive integer value will specify the limit of rows to return from the data set.
Common Configuration Items
Remove non-ASCII Characters Option
By selecting this option, the import will remove any content that is not ASCII. While PlaidCloud fully supports Unicode (UTF-8), real-world files can contain all sorts of encodings and stray characters that make them challenging to process.
If the content of the file is expected to be ASCII only, checking this box will help ensure the import process runs smoothly.
Delete Files After Import Option
This option will allow the import process to delete the file from the PlaidCloud Document account after a successful import has completed.
This can be useful if the import files are generated can be recreated from a system of record or there is no reason to retain the raw input files once they have been processed.
Target Table
The target selection for imports is limited to tables only since views do not contain underlying data.
Dynamic Option
The Dynamic option allows specification of a table using text, including variables. This is useful when employing variable driven workflows where table and view references are relative to the variables specified.
An example that uses the current_month variable to dynamically point to target table:
legal_entity/inputs/{current_month}/ledger_values
Static Option
When a specific table is desired as the target for the import, leave the Dynamic box unchecked and select the target Table.
If the target Table does not exist, select the Create new table button to create the table in the desired location.
Table Explorer is always avaible with any table selection. Click on the Table Explorer button to the right of the table selection and a Table Explorer window will open.
Data Mapper Configuration
The Data Mapper is used to map columns from the source data to the target data table.
Inspection and Populating the Mapper
Using the Inspect Source menu button provides additional ways to map columns from source to target:
- Populate Both Mapping Tables: Propagates all values from the source data table into the target data table. This is done by default.
- Populate Source Mapping Table Only: Maps all values in the source data table only. This is helpful when modifying an existing workflow when source column structure has changed.
- Populate Target Mapping Table Only: Propagates all values into the target data table only.
If the source and target column options aren’t enough, other columns can be added into the target data table in several different ways:
- Propagate All will insert all source columns into the target data table, whether they already existed or not.
- Propagate Selected will insert selected source column(s) only.
- Right click on target side and select Insert Row to insert a row immediately above the currently selected row.
- Right click on target side and select Append Row to insert a row at the bottom (far right) of the target data table.
Deleting Columns
To delete columns from the target data table, select the desired column(s), then right click and select Delete.
Chaging Column Order
To rearrange columns in the target data table, select the desired column(s). You can use either:
- Bulk Move Arrows: Select the desired move option from the arrows in the upper right
- Context Menu: Right clikc and select Move to Top, Move Up, Move Down, or Move to Bottom.
Reduce Result to Distinct Records Only
To return only distinct options, select the Distinct menu option. This will toggle a set of checkboxes for each column in the source. Simply check any box next to the corresponding column to return only distinct results.
Depending on the situation, you may want to consider use of Summarization instead.
The distinct process retains the first unique record found and discards the rest. You may want to apply a sort on the data if it is important for consistency between runs.
Aggregation and Grouping
To aggregate results, select the Summarize menu option. This will toggle a set of select boxes for each column in the target data table. Choose an appropriate summarization method for each column.
- Group By
- Sum
- Min
- Max
- First
- Last
- Count
- Count (including nulls)
- Mean
- Standard Deviation
- Sample Standard Deviation
- Population Standard Deviation
- Variance
- Sample Variance
- Population Variance
- Advanced Non-Group_By
For advanced data mapper usage such as expressions, cleaning, and constants, please see the Advanced Data Mapper Usage
To allow for maximum flexibility, data filters are available on the source data and the target data. For larger data sets, it can be especially beneficial to filter out rows on the source so the remaining operations are performed on a smaller data set.
Select Subset Of Data
This filter type provides a way to filter the inbound source data based on the specified conditions.
Apply Secondary Filter To Result Data
This filter type provides a way to apply a filter to the post-transformed result data based on the specified conditions. The ability to apply a filter on the post-transformed result allows for exclusions based on results of complex calcuations, summarizaitons, or window functions.
Final Data Table Slicing (Limit)
The row slicing capability provides the ability to limit the rows in the result set based on a range and starting point.
Filter Syntax
The filter syntax utilizes Python SQLAlchemy which is the same syntax as other expressions.
View examples and expression functions in the Expressions area.
4.2.13 - Import SAS7BDAT
Description
Import SAS table files from PlaidCloud Document.
Examples
No examples yet...
Unique Configuration Items
None
Common Configuration Items
Remove non-ASCII Characters Option
By selecting this option, the import will remove any content that is not ASCII. While PlaidCloud fully supports Unicode (UTF-8), real-world files can contain all sorts of encodings and stray characters that make them challenging to process.
If the content of the file is expected to be ASCII only, checking this box will help ensure the import process runs smoothly.
Delete Files After Import Option
This option will allow the import process to delete the file from the PlaidCloud Document account after a successful import has completed.
This can be useful if the import files are generated can be recreated from a system of record or there is no reason to retain the raw input files once they have been processed.
Import File Selector
The file selector in this transform allows you to choose a file stored in a PlaidCloud Document location for import.
You can also choose a directory to import and all files within that directory will be imported as part of the transform run.
Selecting a Document Account
Choose a PlaidCloud Document account for which you have access. This will provide you with the ability to select a directory or file in the next selection.
Search Option
The Search option allows for finding all matching files below a specified directory path to import. This can be particularly useful if many files need to be included but they are stored in nested directories or are mixed in with other files within the same directory which you do not want to import.
The search path selected is the starting directory to search under. The search process will look for all files within that directory as well as sub-directories that match the search conditions specified. Ensure the search criteria can be applied to the files within the sub-directories too.
The search can be applied using the following conditions:
- Exact: Match the search text exactly
- Starts With: Match any file that starts with the search text
- Contains: Match any file that contains the search text
- Ends With: Match any file that ends with the search text
File or Directory Selection Option
When a specific file or directory of files are required for import, picking the file or directory is a better option than using search.
To select the file or directory, simply use the browse button to pick the path for the Document account selected above.
Variable Substition
For both the search option and specific file/directory option, variables can be used with in the path, search text, and file names.
An example that uses the current_month variable to dynamically point to the correct file:
legal_entity/inputs/{current_month}/ledger_values.csv
Target Table
The target selection for imports is limited to tables only since views do not contain underlying data.
Dynamic Option
The Dynamic option allows specification of a table using text, including variables. This is useful when employing variable driven workflows where table and view references are relative to the variables specified.
An example that uses the current_month variable to dynamically point to target table:
legal_entity/inputs/{current_month}/ledger_values
Static Option
When a specific table is desired as the target for the import, leave the Dynamic box unchecked and select the target Table.
If the target Table does not exist, select the Create new table button to create the table in the desired location.
Table Explorer is always avaible with any table selection. Click on the Table Explorer button to the right of the table selection and a Table Explorer window will open.
Data Mapper Configuration
The Data Mapper is used to map columns from the source data to the target data table.
Inspection and Populating the Mapper
Using the Inspect Source menu button provides additional ways to map columns from source to target:
- Populate Both Mapping Tables: Propagates all values from the source data table into the target data table. This is done by default.
- Populate Source Mapping Table Only: Maps all values in the source data table only. This is helpful when modifying an existing workflow when source column structure has changed.
- Populate Target Mapping Table Only: Propagates all values into the target data table only.
If the source and target column options aren’t enough, other columns can be added into the target data table in several different ways:
- Propagate All will insert all source columns into the target data table, whether they already existed or not.
- Propagate Selected will insert selected source column(s) only.
- Right click on target side and select Insert Row to insert a row immediately above the currently selected row.
- Right click on target side and select Append Row to insert a row at the bottom (far right) of the target data table.
Deleting Columns
To delete columns from the target data table, select the desired column(s), then right click and select Delete.
Chaging Column Order
To rearrange columns in the target data table, select the desired column(s). You can use either:
- Bulk Move Arrows: Select the desired move option from the arrows in the upper right
- Context Menu: Right clikc and select Move to Top, Move Up, Move Down, or Move to Bottom.
Reduce Result to Distinct Records Only
To return only distinct options, select the Distinct menu option. This will toggle a set of checkboxes for each column in the source. Simply check any box next to the corresponding column to return only distinct results.
Depending on the situation, you may want to consider use of Summarization instead.
The distinct process retains the first unique record found and discards the rest. You may want to apply a sort on the data if it is important for consistency between runs.
Aggregation and Grouping
To aggregate results, select the Summarize menu option. This will toggle a set of select boxes for each column in the target data table. Choose an appropriate summarization method for each column.
- Group By
- Sum
- Min
- Max
- First
- Last
- Count
- Count (including nulls)
- Mean
- Standard Deviation
- Sample Standard Deviation
- Population Standard Deviation
- Variance
- Sample Variance
- Population Variance
- Advanced Non-Group_By
For advanced data mapper usage such as expressions, cleaning, and constants, please see the Advanced Data Mapper Usage
To allow for maximum flexibility, data filters are available on the source data and the target data. For larger data sets, it can be especially beneficial to filter out rows on the source so the remaining operations are performed on a smaller data set.
Select Subset Of Data
This filter type provides a way to filter the inbound source data based on the specified conditions.
Apply Secondary Filter To Result Data
This filter type provides a way to apply a filter to the post-transformed result data based on the specified conditions. The ability to apply a filter on the post-transformed result allows for exclusions based on results of complex calcuations, summarizaitons, or window functions.
Final Data Table Slicing (Limit)
The row slicing capability provides the ability to limit the rows in the result set based on a range and starting point.
Filter Syntax
The filter syntax utilizes Python SQLAlchemy which is the same syntax as other expressions.
View examples and expression functions in the Expressions area.
4.2.14 - Import SPSS
Description
Import SPSS sav and zsav files from PlaidCloud Document.
Examples
No examples yet...
Unique Configuration Items
None
Common Configuration Items
Remove non-ASCII Characters Option
By selecting this option, the import will remove any content that is not ASCII. While PlaidCloud fully supports Unicode (UTF-8), real-world files can contain all sorts of encodings and stray characters that make them challenging to process.
If the content of the file is expected to be ASCII only, checking this box will help ensure the import process runs smoothly.
Delete Files After Import Option
This option will allow the import process to delete the file from the PlaidCloud Document account after a successful import has completed.
This can be useful if the import files are generated can be recreated from a system of record or there is no reason to retain the raw input files once they have been processed.
Import File Selector
The file selector in this transform allows you to choose a file stored in a PlaidCloud Document location for import.
You can also choose a directory to import and all files within that directory will be imported as part of the transform run.
Selecting a Document Account
Choose a PlaidCloud Document account for which you have access. This will provide you with the ability to select a directory or file in the next selection.
Search Option
The Search option allows for finding all matching files below a specified directory path to import. This can be particularly useful if many files need to be included but they are stored in nested directories or are mixed in with other files within the same directory which you do not want to import.
The search path selected is the starting directory to search under. The search process will look for all files within that directory as well as sub-directories that match the search conditions specified. Ensure the search criteria can be applied to the files within the sub-directories too.
The search can be applied using the following conditions:
- Exact: Match the search text exactly
- Starts With: Match any file that starts with the search text
- Contains: Match any file that contains the search text
- Ends With: Match any file that ends with the search text
File or Directory Selection Option
When a specific file or directory of files are required for import, picking the file or directory is a better option than using search.
To select the file or directory, simply use the browse button to pick the path for the Document account selected above.
Variable Substition
For both the search option and specific file/directory option, variables can be used with in the path, search text, and file names.
An example that uses the current_month variable to dynamically point to the correct file:
legal_entity/inputs/{current_month}/ledger_values.csv
Target Table
The target selection for imports is limited to tables only since views do not contain underlying data.
Dynamic Option
The Dynamic option allows specification of a table using text, including variables. This is useful when employing variable driven workflows where table and view references are relative to the variables specified.
An example that uses the current_month variable to dynamically point to target table:
legal_entity/inputs/{current_month}/ledger_values
Static Option
When a specific table is desired as the target for the import, leave the Dynamic box unchecked and select the target Table.
If the target Table does not exist, select the Create new table button to create the table in the desired location.
Table Explorer is always avaible with any table selection. Click on the Table Explorer button to the right of the table selection and a Table Explorer window will open.
Data Mapper Configuration
The Data Mapper is used to map columns from the source data to the target data table.
Inspection and Populating the Mapper
Using the Inspect Source menu button provides additional ways to map columns from source to target:
- Populate Both Mapping Tables: Propagates all values from the source data table into the target data table. This is done by default.
- Populate Source Mapping Table Only: Maps all values in the source data table only. This is helpful when modifying an existing workflow when source column structure has changed.
- Populate Target Mapping Table Only: Propagates all values into the target data table only.
If the source and target column options aren’t enough, other columns can be added into the target data table in several different ways:
- Propagate All will insert all source columns into the target data table, whether they already existed or not.
- Propagate Selected will insert selected source column(s) only.
- Right click on target side and select Insert Row to insert a row immediately above the currently selected row.
- Right click on target side and select Append Row to insert a row at the bottom (far right) of the target data table.
Deleting Columns
To delete columns from the target data table, select the desired column(s), then right click and select Delete.
Chaging Column Order
To rearrange columns in the target data table, select the desired column(s). You can use either:
- Bulk Move Arrows: Select the desired move option from the arrows in the upper right
- Context Menu: Right clikc and select Move to Top, Move Up, Move Down, or Move to Bottom.
Reduce Result to Distinct Records Only
To return only distinct options, select the Distinct menu option. This will toggle a set of checkboxes for each column in the source. Simply check any box next to the corresponding column to return only distinct results.
Depending on the situation, you may want to consider use of Summarization instead.
The distinct process retains the first unique record found and discards the rest. You may want to apply a sort on the data if it is important for consistency between runs.
Aggregation and Grouping
To aggregate results, select the Summarize menu option. This will toggle a set of select boxes for each column in the target data table. Choose an appropriate summarization method for each column.
- Group By
- Sum
- Min
- Max
- First
- Last
- Count
- Count (including nulls)
- Mean
- Standard Deviation
- Sample Standard Deviation
- Population Standard Deviation
- Variance
- Sample Variance
- Population Variance
- Advanced Non-Group_By
For advanced data mapper usage such as expressions, cleaning, and constants, please see the Advanced Data Mapper Usage
To allow for maximum flexibility, data filters are available on the source data and the target data. For larger data sets, it can be especially beneficial to filter out rows on the source so the remaining operations are performed on a smaller data set.
Select Subset Of Data
This filter type provides a way to filter the inbound source data based on the specified conditions.
Apply Secondary Filter To Result Data
This filter type provides a way to apply a filter to the post-transformed result data based on the specified conditions. The ability to apply a filter on the post-transformed result allows for exclusions based on results of complex calcuations, summarizaitons, or window functions.
Final Data Table Slicing (Limit)
The row slicing capability provides the ability to limit the rows in the result set based on a range and starting point.
Filter Syntax
The filter syntax utilizes Python SQLAlchemy which is the same syntax as other expressions.
View examples and expression functions in the Expressions area.
4.2.15 - Import SQL
Description
Import data from a remote SQL database.
Import Parameters
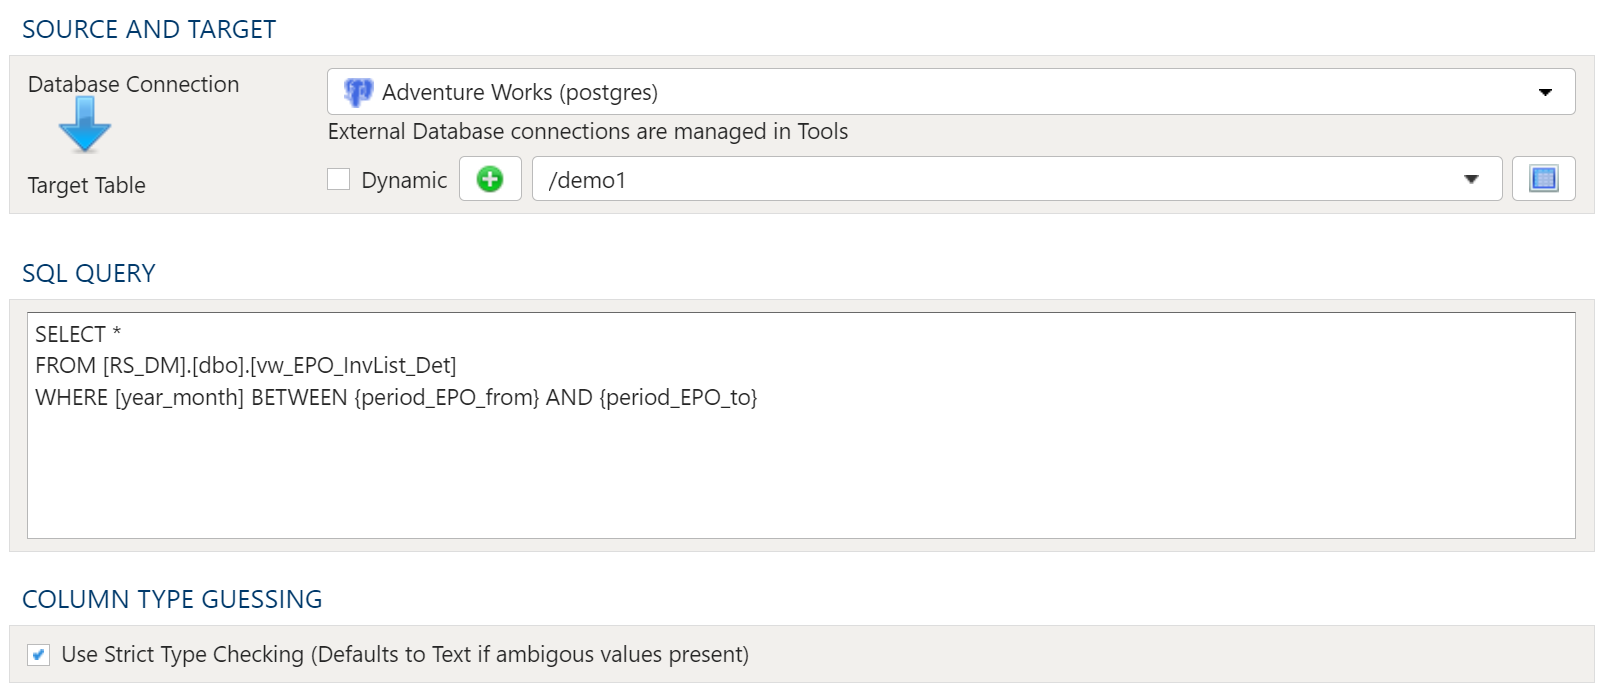
Source And Target
Database Connection
To establish a Database Connection please refer to PlaidCloud Data Connections
Target Table
The target selection for imports is limited to tables only since views do not contain underlying data.
Dynamic Option
The Dynamic option allows specification of a table using text, including variables. This is useful when employing variable driven workflows where table and view references are relative to the variables specified.
An example that uses the current_month variable to dynamically point to target table:
legal_entity/inputs/{current_month}/ledger_values
Static Option
When a specific table is desired as the target for the import, leave the Dynamic box unchecked and select the target Table.
If the target Table does not exist, select the Create new table button to create the table in the desired location.
Table Explorer is always avaible with any table selection. Click on the Table Explorer button to the right of the table selection and a Table Explorer window will open.
SQL Query
In this section write the SQL query to return the required data.
Column Type Guessing
SQL Imports have the option of attempting to guess the data type during load, or to set all columns to type Text. Setting the data types dynamically can be quicker if the data is clean, but can cause issues in some circumstances.
For example, if most of the data appears to be numeric but there is some text as well, it may try to set it as numeric causing load issues with mismatched data types. Or there could be issues if there is a numeric product code that is 16 digits, for example. It would crop the leading zeroes resulting in a number instead of a 16 digit code.
Setting the data to all text, however, requires a subsequent Extract step to convert any data types that shouldn't be text to the appropriate type, like dates or numerical values.
4.2.16 - Import Stata
Description
Import Stata files from PlaidCloud Document.
Examples
No examples yet...
Unique Configuration Items
None
Common Configuration Items
Remove non-ASCII Characters Option
By selecting this option, the import will remove any content that is not ASCII. While PlaidCloud fully supports Unicode (UTF-8), real-world files can contain all sorts of encodings and stray characters that make them challenging to process.
If the content of the file is expected to be ASCII only, checking this box will help ensure the import process runs smoothly.
Delete Files After Import Option
This option will allow the import process to delete the file from the PlaidCloud Document account after a successful import has completed.
This can be useful if the import files are generated can be recreated from a system of record or there is no reason to retain the raw input files once they have been processed.
Import File Selector
The file selector in this transform allows you to choose a file stored in a PlaidCloud Document location for import.
You can also choose a directory to import and all files within that directory will be imported as part of the transform run.
Selecting a Document Account
Choose a PlaidCloud Document account for which you have access. This will provide you with the ability to select a directory or file in the next selection.
Search Option
The Search option allows for finding all matching files below a specified directory path to import. This can be particularly useful if many files need to be included but they are stored in nested directories or are mixed in with other files within the same directory which you do not want to import.
The search path selected is the starting directory to search under. The search process will look for all files within that directory as well as sub-directories that match the search conditions specified. Ensure the search criteria can be applied to the files within the sub-directories too.
The search can be applied using the following conditions:
- Exact: Match the search text exactly
- Starts With: Match any file that starts with the search text
- Contains: Match any file that contains the search text
- Ends With: Match any file that ends with the search text
File or Directory Selection Option
When a specific file or directory of files are required for import, picking the file or directory is a better option than using search.
To select the file or directory, simply use the browse button to pick the path for the Document account selected above.
Variable Substition
For both the search option and specific file/directory option, variables can be used with in the path, search text, and file names.
An example that uses the current_month variable to dynamically point to the correct file:
legal_entity/inputs/{current_month}/ledger_values.csv
Target Table
The target selection for imports is limited to tables only since views do not contain underlying data.
Dynamic Option
The Dynamic option allows specification of a table using text, including variables. This is useful when employing variable driven workflows where table and view references are relative to the variables specified.
An example that uses the current_month variable to dynamically point to target table:
legal_entity/inputs/{current_month}/ledger_values
Static Option
When a specific table is desired as the target for the import, leave the Dynamic box unchecked and select the target Table.
If the target Table does not exist, select the Create new table button to create the table in the desired location.
Table Explorer is always avaible with any table selection. Click on the Table Explorer button to the right of the table selection and a Table Explorer window will open.
Data Mapper Configuration
The Data Mapper is used to map columns from the source data to the target data table.
Inspection and Populating the Mapper
Using the Inspect Source menu button provides additional ways to map columns from source to target:
- Populate Both Mapping Tables: Propagates all values from the source data table into the target data table. This is done by default.
- Populate Source Mapping Table Only: Maps all values in the source data table only. This is helpful when modifying an existing workflow when source column structure has changed.
- Populate Target Mapping Table Only: Propagates all values into the target data table only.
If the source and target column options aren’t enough, other columns can be added into the target data table in several different ways:
- Propagate All will insert all source columns into the target data table, whether they already existed or not.
- Propagate Selected will insert selected source column(s) only.
- Right click on target side and select Insert Row to insert a row immediately above the currently selected row.
- Right click on target side and select Append Row to insert a row at the bottom (far right) of the target data table.
Deleting Columns
To delete columns from the target data table, select the desired column(s), then right click and select Delete.
Chaging Column Order
To rearrange columns in the target data table, select the desired column(s). You can use either:
- Bulk Move Arrows: Select the desired move option from the arrows in the upper right
- Context Menu: Right clikc and select Move to Top, Move Up, Move Down, or Move to Bottom.
Reduce Result to Distinct Records Only
To return only distinct options, select the Distinct menu option. This will toggle a set of checkboxes for each column in the source. Simply check any box next to the corresponding column to return only distinct results.
Depending on the situation, you may want to consider use of Summarization instead.
The distinct process retains the first unique record found and discards the rest. You may want to apply a sort on the data if it is important for consistency between runs.
Aggregation and Grouping
To aggregate results, select the Summarize menu option. This will toggle a set of select boxes for each column in the target data table. Choose an appropriate summarization method for each column.
- Group By
- Sum
- Min
- Max
- First
- Last
- Count
- Count (including nulls)
- Mean
- Standard Deviation
- Sample Standard Deviation
- Population Standard Deviation
- Variance
- Sample Variance
- Population Variance
- Advanced Non-Group_By
For advanced data mapper usage such as expressions, cleaning, and constants, please see the Advanced Data Mapper Usage
To allow for maximum flexibility, data filters are available on the source data and the target data. For larger data sets, it can be especially beneficial to filter out rows on the source so the remaining operations are performed on a smaller data set.
Select Subset Of Data
This filter type provides a way to filter the inbound source data based on the specified conditions.
Apply Secondary Filter To Result Data
This filter type provides a way to apply a filter to the post-transformed result data based on the specified conditions. The ability to apply a filter on the post-transformed result allows for exclusions based on results of complex calcuations, summarizaitons, or window functions.
Final Data Table Slicing (Limit)
The row slicing capability provides the ability to limit the rows in the result set based on a range and starting point.
Filter Syntax
The filter syntax utilizes Python SQLAlchemy which is the same syntax as other expressions.
View examples and expression functions in the Expressions area.
4.2.17 - Import XML
Description
Import XML data as an XML file.
Examples
No examples yet...
Unique Configuration Items
None
Common Configuration Items
Remove non-ASCII Characters Option
By selecting this option, the import will remove any content that is not ASCII. While PlaidCloud fully supports Unicode (UTF-8), real-world files can contain all sorts of encodings and stray characters that make them challenging to process.
If the content of the file is expected to be ASCII only, checking this box will help ensure the import process runs smoothly.
Delete Files After Import Option
This option will allow the import process to delete the file from the PlaidCloud Document account after a successful import has completed.
This can be useful if the import files are generated can be recreated from a system of record or there is no reason to retain the raw input files once they have been processed.
Import File Selector
The file selector in this transform allows you to choose a file stored in a PlaidCloud Document location for import.
You can also choose a directory to import and all files within that directory will be imported as part of the transform run.
Selecting a Document Account
Choose a PlaidCloud Document account for which you have access. This will provide you with the ability to select a directory or file in the next selection.
Search Option
The Search option allows for finding all matching files below a specified directory path to import. This can be particularly useful if many files need to be included but they are stored in nested directories or are mixed in with other files within the same directory which you do not want to import.
The search path selected is the starting directory to search under. The search process will look for all files within that directory as well as sub-directories that match the search conditions specified. Ensure the search criteria can be applied to the files within the sub-directories too.
The search can be applied using the following conditions:
- Exact: Match the search text exactly
- Starts With: Match any file that starts with the search text
- Contains: Match any file that contains the search text
- Ends With: Match any file that ends with the search text
File or Directory Selection Option
When a specific file or directory of files are required for import, picking the file or directory is a better option than using search.
To select the file or directory, simply use the browse button to pick the path for the Document account selected above.
Variable Substition
For both the search option and specific file/directory option, variables can be used with in the path, search text, and file names.
An example that uses the current_month variable to dynamically point to the correct file:
legal_entity/inputs/{current_month}/ledger_values.csv
Target Table
The target selection for imports is limited to tables only since views do not contain underlying data.
Dynamic Option
The Dynamic option allows specification of a table using text, including variables. This is useful when employing variable driven workflows where table and view references are relative to the variables specified.
An example that uses the current_month variable to dynamically point to target table:
legal_entity/inputs/{current_month}/ledger_values
Static Option
When a specific table is desired as the target for the import, leave the Dynamic box unchecked and select the target Table.
If the target Table does not exist, select the Create new table button to create the table in the desired location.
Table Explorer is always avaible with any table selection. Click on the Table Explorer button to the right of the table selection and a Table Explorer window will open.
Data Mapper Configuration
The Data Mapper is used to map columns from the source data to the target data table.
Inspection and Populating the Mapper
Using the Inspect Source menu button provides additional ways to map columns from source to target:
- Populate Both Mapping Tables: Propagates all values from the source data table into the target data table. This is done by default.
- Populate Source Mapping Table Only: Maps all values in the source data table only. This is helpful when modifying an existing workflow when source column structure has changed.
- Populate Target Mapping Table Only: Propagates all values into the target data table only.
If the source and target column options aren’t enough, other columns can be added into the target data table in several different ways:
- Propagate All will insert all source columns into the target data table, whether they already existed or not.
- Propagate Selected will insert selected source column(s) only.
- Right click on target side and select Insert Row to insert a row immediately above the currently selected row.
- Right click on target side and select Append Row to insert a row at the bottom (far right) of the target data table.
Deleting Columns
To delete columns from the target data table, select the desired column(s), then right click and select Delete.
Chaging Column Order
To rearrange columns in the target data table, select the desired column(s). You can use either:
- Bulk Move Arrows: Select the desired move option from the arrows in the upper right
- Context Menu: Right clikc and select Move to Top, Move Up, Move Down, or Move to Bottom.
Reduce Result to Distinct Records Only
To return only distinct options, select the Distinct menu option. This will toggle a set of checkboxes for each column in the source. Simply check any box next to the corresponding column to return only distinct results.
Depending on the situation, you may want to consider use of Summarization instead.
The distinct process retains the first unique record found and discards the rest. You may want to apply a sort on the data if it is important for consistency between runs.
Aggregation and Grouping
To aggregate results, select the Summarize menu option. This will toggle a set of select boxes for each column in the target data table. Choose an appropriate summarization method for each column.
- Group By
- Sum
- Min
- Max
- First
- Last
- Count
- Count (including nulls)
- Mean
- Standard Deviation
- Sample Standard Deviation
- Population Standard Deviation
- Variance
- Sample Variance
- Population Variance
- Advanced Non-Group_By
For advanced data mapper usage such as expressions, cleaning, and constants, please see the Advanced Data Mapper Usage
To allow for maximum flexibility, data filters are available on the source data and the target data. For larger data sets, it can be especially beneficial to filter out rows on the source so the remaining operations are performed on a smaller data set.
Select Subset Of Data
This filter type provides a way to filter the inbound source data based on the specified conditions.
Apply Secondary Filter To Result Data
This filter type provides a way to apply a filter to the post-transformed result data based on the specified conditions. The ability to apply a filter on the post-transformed result allows for exclusions based on results of complex calcuations, summarizaitons, or window functions.
Final Data Table Slicing (Limit)
The row slicing capability provides the ability to limit the rows in the result set based on a range and starting point.
Filter Syntax
The filter syntax utilizes Python SQLAlchemy which is the same syntax as other expressions.
View examples and expression functions in the Expressions area.
4.3 - Export Steps
4.3.1 - Export to CSV
Description
Export an Analyze data table to PlaidCloud Document as a CSV delimited file.
Export Parameters
Export File Selector
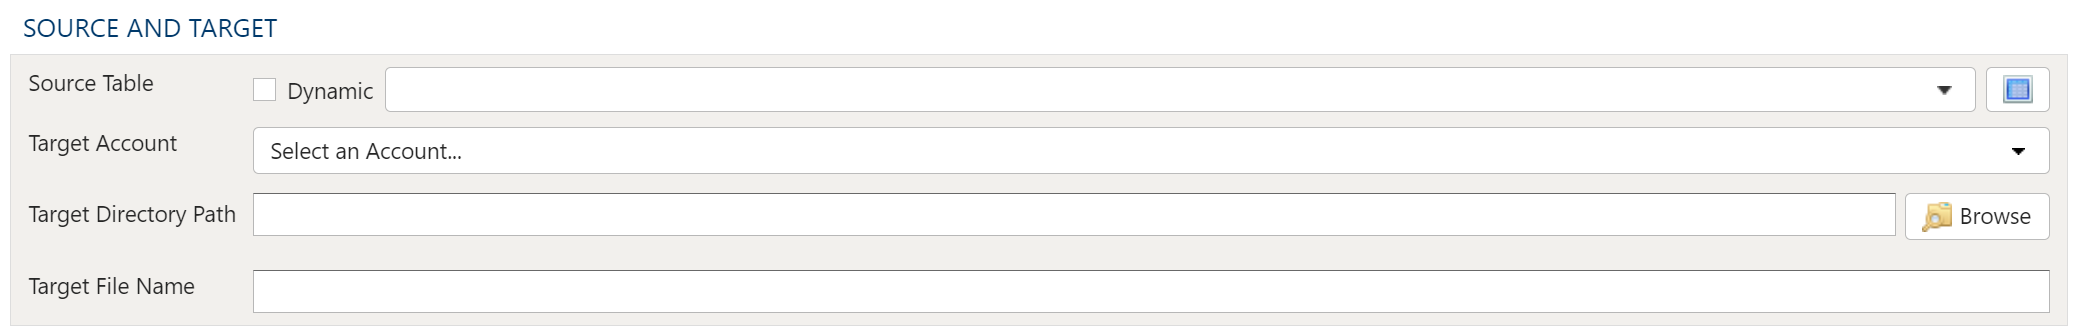
The file selector in this transform allows you to choose a destination store the exported result in a PlaidCloud Document.
You choose a directory and specify a file name for the target file.
Source Table
Dynamic Option
The Dynamic option allows specification of a table using text, including variables. This is useful when employing variable driven workflows where table and view references are relative to the variables specified.
An example that uses the current_month variable to dynamically point to source table:
legal_entity/inputs/{current_month}/ledger_values
Static Option
When a specific table is desired as the source for the export, leave the Dynamic box unchecked and select the source table.
Table Explorer is always avaible with any table selection. Click on the Table Explorer button to the right of the table selection and a Table Explorer window will open.
Selecting a Document Account
Choose a PlaidCloud Document account for which you have access. This will provide you with the ability to select a directory next selection.
Target Directory Path
Select the Browse icon to the right of the Target Directory Path and navigate to the location you want the file saved to.
Target File Name
Specify the name the exported file should be saved as.
Selecting File Compression
All exported files are uncompressed, but the following compression options are available:
- No Compression
- Zip
- GZip
- BZip2
Data Format
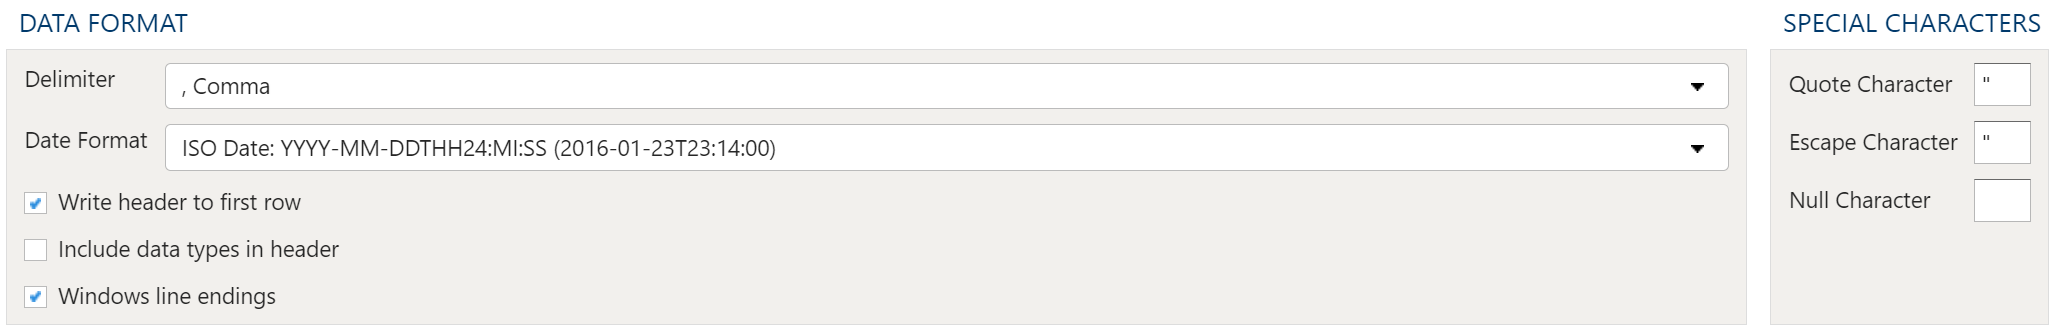
Delimiter
The Export CSV transform is used to export data tables into delimited text files saved in PlaidCloud Document. This includes, but is not limited to, the following delimiter types:
Excel CSV (comma separated)
Excel TSV (tab separated)
User Defined Separator –>
- comma (,)
- pipe (|)
- semicolon (;)
- tab
- space ( )
- other/custom (tilde, dash, etc)
To specify a custom delimiter, select User Defined Separator –> and then Other –>, and type the custom delimiter into the text box.
Special Characters
The Special Characters section allows users to specify how to handle data with quotation marks and escape characters. Choose from the following settings:
- Special Characters (QUOTE_MINIMAL): Quote fields with special characters (anything that would confuse a parser configured with the same dialect and options). This is the default setting.
- All (QUOTE_ALL): Quote everything, regardless of type.
- Non-Numeric (QUOTE_NONNUMERIC): Quote all fields that are not integers or floats. When used with the reader, input fields that are not quoted are converted to floats.
- None (QUOTE_NONE): Do not quote anything on output. Quote characters are included in output with the escape character provided by the user. Note that only a single escape character can be provided.
Write Header To First Row
If this checkbox is selected the table headers will be exported to the first row. If it is not there will be no headers in the exported file.
Include Data Types In Headers
If this checkbox is selected the headers of the exported file will contain the data type for the column.
Windows Line Endings
Lastly, the Use Windows Compatible Line Endings checkbox is selected by default to ensure compatibility with Windows systems. It is advisable to leave this setting on unless working in a unix-only environment.
Table Data Selection
Data Mapper Configuration
The Data Mapper is used to map columns from the source data to the target data table.
Inspection and Populating the Mapper
Using the Inspect Source menu button provides additional ways to map columns from source to target:
- Populate Both Mapping Tables: Propagates all values from the source data table into the target data table. This is done by default.
- Populate Source Mapping Table Only: Maps all values in the source data table only. This is helpful when modifying an existing workflow when source column structure has changed.
- Populate Target Mapping Table Only: Propagates all values into the target data table only.
If the source and target column options aren’t enough, other columns can be added into the target data table in several different ways:
- Propagate All will insert all source columns into the target data table, whether they already existed or not.
- Propagate Selected will insert selected source column(s) only.
- Right click on target side and select Insert Row to insert a row immediately above the currently selected row.
- Right click on target side and select Append Row to insert a row at the bottom (far right) of the target data table.
Deleting Columns
To delete columns from the target data table, select the desired column(s), then right click and select Delete.
Chaging Column Order
To rearrange columns in the target data table, select the desired column(s). You can use either:
- Bulk Move Arrows: Select the desired move option from the arrows in the upper right
- Context Menu: Right clikc and select Move to Top, Move Up, Move Down, or Move to Bottom.
Reduce Result to Distinct Records Only
To return only distinct options, select the Distinct menu option. This will toggle a set of checkboxes for each column in the source. Simply check any box next to the corresponding column to return only distinct results.
Depending on the situation, you may want to consider use of Summarization instead.
The distinct process retains the first unique record found and discards the rest. You may want to apply a sort on the data if it is important for consistency between runs.
Aggregation and Grouping
To aggregate results, select the Summarize menu option. This will toggle a set of select boxes for each column in the target data table. Choose an appropriate summarization method for each column.
- Group By
- Sum
- Min
- Max
- First
- Last
- Count
- Count (including nulls)
- Mean
- Standard Deviation
- Sample Standard Deviation
- Population Standard Deviation
- Variance
- Sample Variance
- Population Variance
- Advanced Non-Group_By
For advanced data mapper usage such as expressions, cleaning, and constants, please see the Advanced Data Mapper Usage
For more aggregation details, see the Analyze overview page here.
Data Filters
To allow for maximum flexibility, data filters are available on the source data and the target data. For larger data sets, it can be especially beneficial to filter out rows on the source so the remaining operations are performed on a smaller data set.
Select Subset Of Data
This filter type provides a way to filter the inbound source data based on the specified conditions.
Apply Secondary Filter To Result Data
This filter type provides a way to apply a filter to the post-transformed result data based on the specified conditions. The ability to apply a filter on the post-transformed result allows for exclusions based on results of complex calcuations, summarizaitons, or window functions.
Final Data Table Slicing (Limit)
The row slicing capability provides the ability to limit the rows in the result set based on a range and starting point.
Filter Syntax
The filter syntax utilizes Python SQLAlchemy which is the same syntax as other expressions.
View examples and expression functions in the Expressions area.
Examples
No examples yet...
4.3.2 - Export to Excel
Description
Export an Analyze data table to PlaidCloud Document as a Microsoft Excel file. PlaidCloud Analyze supports modern versions of Microsoft Excel (2007-2016) as well as legacy versions (2000/2003).
Export Parameters
Export File Selector
The file selector in this transform allows you to choose a destination store the exported result in a PlaidCloud Document.
You choose a directory and specify a file name for the target file.
Source Table
Dynamic Option
The Dynamic option allows specification of a table using text, including variables. This is useful when employing variable driven workflows where table and view references are relative to the variables specified.
An example that uses the current_month variable to dynamically point to source table:
legal_entity/inputs/{current_month}/ledger_values
Static Option
When a specific table is desired as the source for the export, leave the Dynamic box unchecked and select the source table.
Table Explorer is always avaible with any table selection. Click on the Table Explorer button to the right of the table selection and a Table Explorer window will open.
Selecting a Document Account
Choose a PlaidCloud Document account for which you have access. This will provide you with the ability to select a directory next selection.
Target Directory Path
Select the Browse icon to the right of the Target Directory Path and navigate to the location you want the file saved to.
Target File Name
Specify the name the exported file should be saved as.
Target Sheet Name
Specify the target sheet name, the default is Sheet1
Selecting File Compression
All exported files are uncompressed, but the following compression options are available:
- No Compression
- Zip
- GZip
- BZip2
Write Header To First Row
If this checkbox is selected the table headers will be exported to the first row. If it is not there will be no headers in the exported file.
Table Data Selection
Data Mapper Configuration
The Data Mapper is used to map columns from the source data to the target data table.
Inspection and Populating the Mapper
Using the Inspect Source menu button provides additional ways to map columns from source to target:
- Populate Both Mapping Tables: Propagates all values from the source data table into the target data table. This is done by default.
- Populate Source Mapping Table Only: Maps all values in the source data table only. This is helpful when modifying an existing workflow when source column structure has changed.
- Populate Target Mapping Table Only: Propagates all values into the target data table only.
If the source and target column options aren’t enough, other columns can be added into the target data table in several different ways:
- Propagate All will insert all source columns into the target data table, whether they already existed or not.
- Propagate Selected will insert selected source column(s) only.
- Right click on target side and select Insert Row to insert a row immediately above the currently selected row.
- Right click on target side and select Append Row to insert a row at the bottom (far right) of the target data table.
Deleting Columns
To delete columns from the target data table, select the desired column(s), then right click and select Delete.
Chaging Column Order
To rearrange columns in the target data table, select the desired column(s). You can use either:
- Bulk Move Arrows: Select the desired move option from the arrows in the upper right
- Context Menu: Right clikc and select Move to Top, Move Up, Move Down, or Move to Bottom.
Reduce Result to Distinct Records Only
To return only distinct options, select the Distinct menu option. This will toggle a set of checkboxes for each column in the source. Simply check any box next to the corresponding column to return only distinct results.
Depending on the situation, you may want to consider use of Summarization instead.
The distinct process retains the first unique record found and discards the rest. You may want to apply a sort on the data if it is important for consistency between runs.
Aggregation and Grouping
To aggregate results, select the Summarize menu option. This will toggle a set of select boxes for each column in the target data table. Choose an appropriate summarization method for each column.
- Group By
- Sum
- Min
- Max
- First
- Last
- Count
- Count (including nulls)
- Mean
- Standard Deviation
- Sample Standard Deviation
- Population Standard Deviation
- Variance
- Sample Variance
- Population Variance
- Advanced Non-Group_By
For advanced data mapper usage such as expressions, cleaning, and constants, please see the Advanced Data Mapper Usage
For more aggregation details, see the Analyze overview page here.
Data Filters
To allow for maximum flexibility, data filters are available on the source data and the target data. For larger data sets, it can be especially beneficial to filter out rows on the source so the remaining operations are performed on a smaller data set.
Select Subset Of Data
This filter type provides a way to filter the inbound source data based on the specified conditions.
Apply Secondary Filter To Result Data
This filter type provides a way to apply a filter to the post-transformed result data based on the specified conditions. The ability to apply a filter on the post-transformed result allows for exclusions based on results of complex calcuations, summarizaitons, or window functions.
Final Data Table Slicing (Limit)
The row slicing capability provides the ability to limit the rows in the result set based on a range and starting point.
Filter Syntax
The filter syntax utilizes Python SQLAlchemy which is the same syntax as other expressions.
View examples and expression functions in the Expressions area.
Examples
No examples yet...
4.3.3 - Export to External Project Table
Description
Export data from a project table to different project's table.
Data Sharing Management
In order to export a table to another project you must first go to both projects Home Tab and allow the projects to share data with each other. To do this select New Data Share and select the project and give them Read access.
Export External Project Table
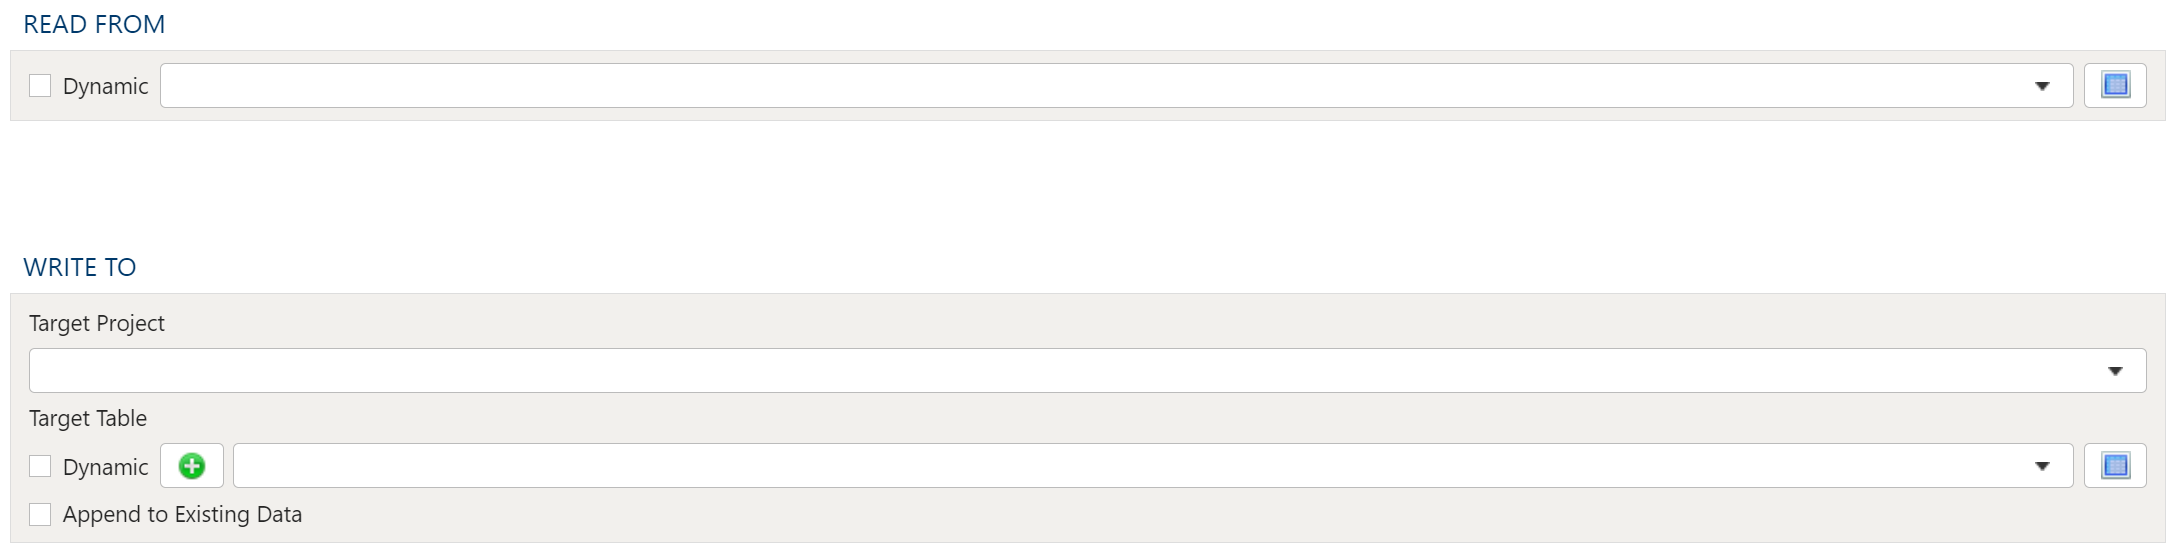
Read From
Select the Source Table from the drop down menu.
Write To
Target Project
Select the Target Project from the drop down menu.
Target Table Static
To establish the target table select either an existing table as the target table using the Target Table dropdown or click on the green "+" sign to create a new table as the target.
Table Creation
When creating a new table you will have the option to either create it as a View or as a Table.
Views:
Views are useful in that the time required for a step to execute is significantly less than when a table is used. The downside of views is they are not a useful for data exploration in the table Details mode.
Tables:
When using a table as the target a step will take longer to execute but data exploration in the Details mode is much quicker than with a view.
Target Table Dynamic
The Dynamic option allows specification of a table using text, including variables. This is useful when employing variable driven workflows where table and view references are relative to the variables specified.
An example that uses the current_month variable to dynamically point to target table:
legal_entity/inputs/{current_month}/ledger_values
Append to Existing Data
To append the data from the source table to the target table select the Append to Existing Data check box.
4.3.4 - Export to Google Spreadsheet
Description
Export an Analyze data table to Google Drive as a Google Spreadsheet. A valid Google account is required to use this transform. User credentials must be set up in PlaidCloud Tools prior to using the transform.
Export Parameters
Source and Target
Select the Source Table from PlaidCloud Document using the dropdown menu.
Next, specify the Target Connection information. For details on setting up a Google Docs account connection, see here: PlaidCloud Tools – Connection. Once all necessary accounts have been set up, select the appropriate account from the dropdown list.
Finally, provide the Target Spreadsheet Name and Target Worksheet Name. If desired, select the Append data to existing Worksheet data checkbox to append data to an existing Worksheet. If the target worksheet does not yet exist, it will be created.
Table Data Selection
Data Mapper Configuration
The Data Mapper is used to map columns from the source data to the target data table.
Inspection and Populating the Mapper
Using the Inspect Source menu button provides additional ways to map columns from source to target:
- Populate Both Mapping Tables: Propagates all values from the source data table into the target data table. This is done by default.
- Populate Source Mapping Table Only: Maps all values in the source data table only. This is helpful when modifying an existing workflow when source column structure has changed.
- Populate Target Mapping Table Only: Propagates all values into the target data table only.
If the source and target column options aren’t enough, other columns can be added into the target data table in several different ways:
- Propagate All will insert all source columns into the target data table, whether they already existed or not.
- Propagate Selected will insert selected source column(s) only.
- Right click on target side and select Insert Row to insert a row immediately above the currently selected row.
- Right click on target side and select Append Row to insert a row at the bottom (far right) of the target data table.
Deleting Columns
To delete columns from the target data table, select the desired column(s), then right click and select Delete.
Chaging Column Order
To rearrange columns in the target data table, select the desired column(s). You can use either:
- Bulk Move Arrows: Select the desired move option from the arrows in the upper right
- Context Menu: Right clikc and select Move to Top, Move Up, Move Down, or Move to Bottom.
Reduce Result to Distinct Records Only
To return only distinct options, select the Distinct menu option. This will toggle a set of checkboxes for each column in the source. Simply check any box next to the corresponding column to return only distinct results.
Depending on the situation, you may want to consider use of Summarization instead.
The distinct process retains the first unique record found and discards the rest. You may want to apply a sort on the data if it is important for consistency between runs.
Aggregation and Grouping
To aggregate results, select the Summarize menu option. This will toggle a set of select boxes for each column in the target data table. Choose an appropriate summarization method for each column.
- Group By
- Sum
- Min
- Max
- First
- Last
- Count
- Count (including nulls)
- Mean
- Standard Deviation
- Sample Standard Deviation
- Population Standard Deviation
- Variance
- Sample Variance
- Population Variance
- Advanced Non-Group_By
For advanced data mapper usage such as expressions, cleaning, and constants, please see the Advanced Data Mapper Usage
For more aggregation details, see the Analyze overview page here.
Data Filters
To allow for maximum flexibility, data filters are available on the source data and the target data. For larger data sets, it can be especially beneficial to filter out rows on the source so the remaining operations are performed on a smaller data set.
Select Subset Of Data
This filter type provides a way to filter the inbound source data based on the specified conditions.
Apply Secondary Filter To Result Data
This filter type provides a way to apply a filter to the post-transformed result data based on the specified conditions. The ability to apply a filter on the post-transformed result allows for exclusions based on results of complex calcuations, summarizaitons, or window functions.
Final Data Table Slicing (Limit)
The row slicing capability provides the ability to limit the rows in the result set based on a range and starting point.
Filter Syntax
The filter syntax utilizes Python SQLAlchemy which is the same syntax as other expressions.
View examples and expression functions in the Expressions area.
Examples
No examples yet...
4.3.5 - Export to HDF
Description
Export an Analyze data table to PlaidCloud Document as an HDF5 file.
For more details on HDF5 files, see the HDF Group’s official website here: http://www.hdfgroup.org/HDF5/.
Export Parameters
Export File Selector
The file selector in this transform allows you to choose a destination store the exported result in a PlaidCloud Document.
You choose a directory and specify a file name for the target file.
Source Table
Dynamic Option
The Dynamic option allows specification of a table using text, including variables. This is useful when employing variable driven workflows where table and view references are relative to the variables specified.
An example that uses the current_month variable to dynamically point to source table:
legal_entity/inputs/{current_month}/ledger_values
Static Option
When a specific table is desired as the source for the export, leave the Dynamic box unchecked and select the source table.
Table Explorer is always avaible with any table selection. Click on the Table Explorer button to the right of the table selection and a Table Explorer window will open.
Selecting a Document Account
Choose a PlaidCloud Document account for which you have access. This will provide you with the ability to select a directory next selection.
Target Directory Path
Select the Browse icon to the right of the Target Directory Path and navigate to the location you want the file saved to.
Target File Name
Specify the name the exported file should be saved as.
Output File Type
All exported files are uncompressed, but the following compression options are available:
- Zip
- GZip
- BZip2
Table Data Selection
Data Mapper Configuration
The Data Mapper is used to map columns from the source data to the target data table.
Inspection and Populating the Mapper
Using the Inspect Source menu button provides additional ways to map columns from source to target:
- Populate Both Mapping Tables: Propagates all values from the source data table into the target data table. This is done by default.
- Populate Source Mapping Table Only: Maps all values in the source data table only. This is helpful when modifying an existing workflow when source column structure has changed.
- Populate Target Mapping Table Only: Propagates all values into the target data table only.
If the source and target column options aren’t enough, other columns can be added into the target data table in several different ways:
- Propagate All will insert all source columns into the target data table, whether they already existed or not.
- Propagate Selected will insert selected source column(s) only.
- Right click on target side and select Insert Row to insert a row immediately above the currently selected row.
- Right click on target side and select Append Row to insert a row at the bottom (far right) of the target data table.
Deleting Columns
To delete columns from the target data table, select the desired column(s), then right click and select Delete.
Chaging Column Order
To rearrange columns in the target data table, select the desired column(s). You can use either:
- Bulk Move Arrows: Select the desired move option from the arrows in the upper right
- Context Menu: Right clikc and select Move to Top, Move Up, Move Down, or Move to Bottom.
Reduce Result to Distinct Records Only
To return only distinct options, select the Distinct menu option. This will toggle a set of checkboxes for each column in the source. Simply check any box next to the corresponding column to return only distinct results.
Depending on the situation, you may want to consider use of Summarization instead.
The distinct process retains the first unique record found and discards the rest. You may want to apply a sort on the data if it is important for consistency between runs.
Aggregation and Grouping
To aggregate results, select the Summarize menu option. This will toggle a set of select boxes for each column in the target data table. Choose an appropriate summarization method for each column.
- Group By
- Sum
- Min
- Max
- First
- Last
- Count
- Count (including nulls)
- Mean
- Standard Deviation
- Sample Standard Deviation
- Population Standard Deviation
- Variance
- Sample Variance
- Population Variance
- Advanced Non-Group_By
For advanced data mapper usage such as expressions, cleaning, and constants, please see the Advanced Data Mapper Usage
For more aggregation details, see the Analyze overview page here.
Data Filters
To allow for maximum flexibility, data filters are available on the source data and the target data. For larger data sets, it can be especially beneficial to filter out rows on the source so the remaining operations are performed on a smaller data set.
Select Subset Of Data
This filter type provides a way to filter the inbound source data based on the specified conditions.
Apply Secondary Filter To Result Data
This filter type provides a way to apply a filter to the post-transformed result data based on the specified conditions. The ability to apply a filter on the post-transformed result allows for exclusions based on results of complex calcuations, summarizaitons, or window functions.
Final Data Table Slicing (Limit)
The row slicing capability provides the ability to limit the rows in the result set based on a range and starting point.
Filter Syntax
The filter syntax utilizes Python SQLAlchemy which is the same syntax as other expressions.
View examples and expression functions in the Expressions area.
Examples
No examples yet...
4.3.6 - Export to HTML
Description
Export an Analyze data table to PlaidCloud Document as an HTML file. The resultant HTML file will simply contain a table.
Export Parameters
Export File Selector
The file selector in this transform allows you to choose a destination store the exported result in a PlaidCloud Document.
You choose a directory and specify a file name for the target file.
Source Table
Dynamic Option
The Dynamic option allows specification of a table using text, including variables. This is useful when employing variable driven workflows where table and view references are relative to the variables specified.
An example that uses the current_month variable to dynamically point to source table:
legal_entity/inputs/{current_month}/ledger_values
Static Option
When a specific table is desired as the source for the export, leave the Dynamic box unchecked and select the source table.
Table Explorer is always avaible with any table selection. Click on the Table Explorer button to the right of the table selection and a Table Explorer window will open.
Selecting a Document Account
Choose a PlaidCloud Document account for which you have access. This will provide you with the ability to select a directory next selection.
Target Directory Path
Select the Browse icon to the right of the Target Directory Path and navigate to the location you want the file saved to.
Target File Name
Specify the name the exported file should be saved as.

Bold Rows
Select this checkbox to make the first row (header row) bold font.
Escape
This option is enabled by default. When the checkbox is selected, the export process will convert the characters <, >, and & to HTML-safe sequences.
Double Precision
See details here:
Output File Type
All exported files are uncompressed, but the following compression options are available:
- Zip
- GZip
- BZip2
Table Data Selection
Data Mapper Configuration
The Data Mapper is used to map columns from the source data to the target data table.
Inspection and Populating the Mapper
Using the Inspect Source menu button provides additional ways to map columns from source to target:
- Populate Both Mapping Tables: Propagates all values from the source data table into the target data table. This is done by default.
- Populate Source Mapping Table Only: Maps all values in the source data table only. This is helpful when modifying an existing workflow when source column structure has changed.
- Populate Target Mapping Table Only: Propagates all values into the target data table only.
If the source and target column options aren’t enough, other columns can be added into the target data table in several different ways:
- Propagate All will insert all source columns into the target data table, whether they already existed or not.
- Propagate Selected will insert selected source column(s) only.
- Right click on target side and select Insert Row to insert a row immediately above the currently selected row.
- Right click on target side and select Append Row to insert a row at the bottom (far right) of the target data table.
Deleting Columns
To delete columns from the target data table, select the desired column(s), then right click and select Delete.
Chaging Column Order
To rearrange columns in the target data table, select the desired column(s). You can use either:
- Bulk Move Arrows: Select the desired move option from the arrows in the upper right
- Context Menu: Right clikc and select Move to Top, Move Up, Move Down, or Move to Bottom.
Reduce Result to Distinct Records Only
To return only distinct options, select the Distinct menu option. This will toggle a set of checkboxes for each column in the source. Simply check any box next to the corresponding column to return only distinct results.
Depending on the situation, you may want to consider use of Summarization instead.
The distinct process retains the first unique record found and discards the rest. You may want to apply a sort on the data if it is important for consistency between runs.
Aggregation and Grouping
To aggregate results, select the Summarize menu option. This will toggle a set of select boxes for each column in the target data table. Choose an appropriate summarization method for each column.
- Group By
- Sum
- Min
- Max
- First
- Last
- Count
- Count (including nulls)
- Mean
- Standard Deviation
- Sample Standard Deviation
- Population Standard Deviation
- Variance
- Sample Variance
- Population Variance
- Advanced Non-Group_By
For advanced data mapper usage such as expressions, cleaning, and constants, please see the Advanced Data Mapper Usage
For more aggregation details, see the Analyze overview page here.
Data Filters
To allow for maximum flexibility, data filters are available on the source data and the target data. For larger data sets, it can be especially beneficial to filter out rows on the source so the remaining operations are performed on a smaller data set.
Select Subset Of Data
This filter type provides a way to filter the inbound source data based on the specified conditions.
Apply Secondary Filter To Result Data
This filter type provides a way to apply a filter to the post-transformed result data based on the specified conditions. The ability to apply a filter on the post-transformed result allows for exclusions based on results of complex calcuations, summarizaitons, or window functions.
Final Data Table Slicing (Limit)
The row slicing capability provides the ability to limit the rows in the result set based on a range and starting point.
Filter Syntax
The filter syntax utilizes Python SQLAlchemy which is the same syntax as other expressions.
View examples and expression functions in the Expressions area.
Examples
No examples yet...
4.3.7 - Export to JSON
Description
Export an Analyze data table to PlaidCloud Document as a JSON file. There are several options (shown below) for data orientation.
For more details on JSON files, see the JSON official website here: http://json.org/.
Export Parameters
Export File Selector
The file selector in this transform allows you to choose a destination store the exported result in a PlaidCloud Document.
You choose a directory and specify a file name for the target file.
Source Table
Dynamic Option
The Dynamic option allows specification of a table using text, including variables. This is useful when employing variable driven workflows where table and view references are relative to the variables specified.
An example that uses the current_month variable to dynamically point to source table:
legal_entity/inputs/{current_month}/ledger_values
Static Option
When a specific table is desired as the source for the export, leave the Dynamic box unchecked and select the source table.
Table Explorer is always avaible with any table selection. Click on the Table Explorer button to the right of the table selection and a Table Explorer window will open.
Selecting a Document Account
Choose a PlaidCloud Document account for which you have access. This will provide you with the ability to select a directory next selection.
Target Directory Path
Select the Browse icon to the right of the Target Directory Path and navigate to the location you want the file saved to.
Target File Name
Specify the name the exported file should be saved as.
JSON Orientation
Consider the following data set:
| ID | Name | Gender | State |
|---|---|---|---|
| 1 | Jack | M | MO |
| 2 | Jill | F | MO |
| 3 | George | M | VA |
| 4 | Abe | M | KY |
JSON files can be exported into one of four data formats:
- Records: Data is stored in Python dictionary sets, with each row stored in {Column -> Value, …} format. For example: [{“ID”:1,”Name”:”Jack”,”Gender”:”M”,”State”:”MO”},{“ID”:2,”Name”:”Jill”,”Gender”:”F”,”State”:”MO”},{“ID”:3,”Name”:”George”,”Gender”:”M”,”State”:”VA”},{“ID”:4,”Name”:”Abe”,”Gender”:”M”,”State”:”KY”}]
- Index: Data is stored in nested Python dictionary sets, with each row stored in {Index -> {Column -> Value, …},…} format. For example: {“0”:{“ID”:1,”Name”:”Jack”,”Gender”:”M”,”State”:”MO”},”1”:{“ID”:2,”Name”:”Jill”,”Gender”:”F”,”State”:”MO”},”2”:{“ID”:3,”Name”:”George”,”Gender”:”M”,”State”:”VA”},”3”:{“ID”:4,”Name”:”Abe”,”Gender”:”M”,”State”:”KY”}}
- Split: Data is stored in a single Python dictionary set, values are stored in lists. For example: {“columns”:[“ID”,”Name”,”Gender”,”State”],”index”:[0,1,2,3],”data”:[[1,”Jack”,”M”,”MO”],[2,”Jill”,”F”,”MO”],[3,”George”,”M”,”VA”],[4,”Abe”,”M”,”KY”]]}
- Values: Data is stored in multiple Python lists. For example: [[1,”Jack”,”M”,”MO”],[2,”Jill”,”F”,”MO”],[3,”George”,”M”,”VA”],[4,”Abe”,”M”,”KY”]]
Date Handling
Specify Date Format using the dropdown menu. Choose from the following formats:
- Epoch (Unix Timestamp – Seconds since 1/1/1970)
- ISO 8601 Format (YYYY-MM-DD HH:MM:SS with timeproject offset)
Specify Date Unit using the dropdown menu. Choose from the following formats, listed in order of increasing precision:
- Seconds (s)
- Milliseconds (ms)
- Microseconds (us)
- Nanoseconds (ns)
Force ASCII
Select this checkbox to ensure that all strings are encoded in proper ASCII format. This is enabled by default.
Output File Type
All exported files are uncompressed, but the following compression options are available:
- Zip
- GZip
- BZip2
Table Data Selection
Data Mapper Configuration
The Data Mapper is used to map columns from the source data to the target data table.
Inspection and Populating the Mapper
Using the Inspect Source menu button provides additional ways to map columns from source to target:
- Populate Both Mapping Tables: Propagates all values from the source data table into the target data table. This is done by default.
- Populate Source Mapping Table Only: Maps all values in the source data table only. This is helpful when modifying an existing workflow when source column structure has changed.
- Populate Target Mapping Table Only: Propagates all values into the target data table only.
If the source and target column options aren’t enough, other columns can be added into the target data table in several different ways:
- Propagate All will insert all source columns into the target data table, whether they already existed or not.
- Propagate Selected will insert selected source column(s) only.
- Right click on target side and select Insert Row to insert a row immediately above the currently selected row.
- Right click on target side and select Append Row to insert a row at the bottom (far right) of the target data table.
Deleting Columns
To delete columns from the target data table, select the desired column(s), then right click and select Delete.
Chaging Column Order
To rearrange columns in the target data table, select the desired column(s). You can use either:
- Bulk Move Arrows: Select the desired move option from the arrows in the upper right
- Context Menu: Right clikc and select Move to Top, Move Up, Move Down, or Move to Bottom.
Reduce Result to Distinct Records Only
To return only distinct options, select the Distinct menu option. This will toggle a set of checkboxes for each column in the source. Simply check any box next to the corresponding column to return only distinct results.
Depending on the situation, you may want to consider use of Summarization instead.
The distinct process retains the first unique record found and discards the rest. You may want to apply a sort on the data if it is important for consistency between runs.
Aggregation and Grouping
To aggregate results, select the Summarize menu option. This will toggle a set of select boxes for each column in the target data table. Choose an appropriate summarization method for each column.
- Group By
- Sum
- Min
- Max
- First
- Last
- Count
- Count (including nulls)
- Mean
- Standard Deviation
- Sample Standard Deviation
- Population Standard Deviation
- Variance
- Sample Variance
- Population Variance
- Advanced Non-Group_By
For advanced data mapper usage such as expressions, cleaning, and constants, please see the Advanced Data Mapper Usage
For more aggregation details, see the Analyze overview page here.
Data Filters
To allow for maximum flexibility, data filters are available on the source data and the target data. For larger data sets, it can be especially beneficial to filter out rows on the source so the remaining operations are performed on a smaller data set.
Select Subset Of Data
This filter type provides a way to filter the inbound source data based on the specified conditions.
Apply Secondary Filter To Result Data
This filter type provides a way to apply a filter to the post-transformed result data based on the specified conditions. The ability to apply a filter on the post-transformed result allows for exclusions based on results of complex calcuations, summarizaitons, or window functions.
Final Data Table Slicing (Limit)
The row slicing capability provides the ability to limit the rows in the result set based on a range and starting point.
Filter Syntax
The filter syntax utilizes Python SQLAlchemy which is the same syntax as other expressions.
View examples and expression functions in the Expressions area.
Examples
No examples yet...
4.3.8 - Export to Quandl
Description
Export an Analyze data table to Quandl’s database.
Source and Target
Specify the following parameters:
- Source Table: Analyze data table to export
- Quandl Connection: Accessing Quandl data sets requires a user account or a guest account with limited access. This requires set up in Tools. For details on setting up a Quandl account connection, see here: PlaidCloud Tools – Connection
- Quandl Code: Use the Search button to search for data sets. Alternatively, data sets can be entered manually. This requires the user to enter the portion of the URL after “http://www.quandl.com”. For example, to import the data set for Microsoft stock, which can be found here (http://www.quandl.com/GOOG/NASDAQ_MSFT), enter GOOG/NASDAQ_MSFT in the Quandl Code field
- Dataset Name: Name of the dataset to be exported to Quandl
- Dataset Description: Description of dataset to be exported to Quandl
Table Data Selection
Data Mapper Configuration
The Data Mapper is used to map columns from the source data to the target data table.
Inspection and Populating the Mapper
Using the Inspect Source menu button provides additional ways to map columns from source to target:
- Populate Both Mapping Tables: Propagates all values from the source data table into the target data table. This is done by default.
- Populate Source Mapping Table Only: Maps all values in the source data table only. This is helpful when modifying an existing workflow when source column structure has changed.
- Populate Target Mapping Table Only: Propagates all values into the target data table only.
If the source and target column options aren’t enough, other columns can be added into the target data table in several different ways:
- Propagate All will insert all source columns into the target data table, whether they already existed or not.
- Propagate Selected will insert selected source column(s) only.
- Right click on target side and select Insert Row to insert a row immediately above the currently selected row.
- Right click on target side and select Append Row to insert a row at the bottom (far right) of the target data table.
Deleting Columns
To delete columns from the target data table, select the desired column(s), then right click and select Delete.
Chaging Column Order
To rearrange columns in the target data table, select the desired column(s). You can use either:
- Bulk Move Arrows: Select the desired move option from the arrows in the upper right
- Context Menu: Right clikc and select Move to Top, Move Up, Move Down, or Move to Bottom.
Reduce Result to Distinct Records Only
To return only distinct options, select the Distinct menu option. This will toggle a set of checkboxes for each column in the source. Simply check any box next to the corresponding column to return only distinct results.
Depending on the situation, you may want to consider use of Summarization instead.
The distinct process retains the first unique record found and discards the rest. You may want to apply a sort on the data if it is important for consistency between runs.
Aggregation and Grouping
To aggregate results, select the Summarize menu option. This will toggle a set of select boxes for each column in the target data table. Choose an appropriate summarization method for each column.
- Group By
- Sum
- Min
- Max
- First
- Last
- Count
- Count (including nulls)
- Mean
- Standard Deviation
- Sample Standard Deviation
- Population Standard Deviation
- Variance
- Sample Variance
- Population Variance
- Advanced Non-Group_By
For advanced data mapper usage such as expressions, cleaning, and constants, please see the Advanced Data Mapper Usage
For more aggregation details, see the Analyze overview page here.
Data Filters
To allow for maximum flexibility, data filters are available on the source data and the target data. For larger data sets, it can be especially beneficial to filter out rows on the source so the remaining operations are performed on a smaller data set.
Select Subset Of Data
This filter type provides a way to filter the inbound source data based on the specified conditions.
Apply Secondary Filter To Result Data
This filter type provides a way to apply a filter to the post-transformed result data based on the specified conditions. The ability to apply a filter on the post-transformed result allows for exclusions based on results of complex calcuations, summarizaitons, or window functions.
Final Data Table Slicing (Limit)
The row slicing capability provides the ability to limit the rows in the result set based on a range and starting point.
Filter Syntax
The filter syntax utilizes Python SQLAlchemy which is the same syntax as other expressions.
View examples and expression functions in the Expressions area.
Examples
No examples yet...
4.3.9 - Export to SQL
Description
Export an Analyze data table to PlaidCloud Document as an SQL.
Examples
No examples yet...
4.3.10 - Export to Table Archive
Description
Exports PlaidCloud table archive file.
Export Parameters
Export File Selector
The file selector in this transform allows you to choose a destination store the exported result in a PlaidCloud Document.
You choose a directory and specify a file name for the target file.
Source Table
Dynamic Option
The Dynamic option allows specification of a table using text, including variables. This is useful when employing variable driven workflows where table and view references are relative to the variables specified.
An example that uses the current_month variable to dynamically point to source table:
legal_entity/inputs/{current_month}/ledger_values
Static Option
When a specific table is desired as the source for the export, leave the Dynamic box unchecked and select the source table.
Table Explorer is always avaible with any table selection. Click on the Table Explorer button to the right of the table selection and a Table Explorer window will open.
Selecting a Document Account
Choose a PlaidCloud Document account for which you have access. This will provide you with the ability to select a directory next selection.
Target Directory Path
Select the Browse icon to the right of the Target Directory Path and navigate to the location you want the file saved to.
Target File Name
Specify the name the exported file should be saved as.
Examples
No examples yet...
4.3.11 - Export to XML
Description
Export an Analyze data table to PlaidCloud Document as an XML file.
4.4 - Table Steps
4.4.1 - Table Anti Join
Description
Table Anti Join provides the unmatched set of items between two tables. This will return the list of items in the first table without matches in the second table. This can be quite useful for determining which records are present in one table but not another.
This operation could be accomplished by using outer joins and filtering on null values for the join; however, the Anti Join transform will perform this in a more efficient and obvious way.
Table Data Selection
Table Source
Specify the source data table by selecting it from the dropdown menu.
Source Columns
Specify any columns to be included here. Selecting the Inspect Source and Populate Source Mapping Table buttons will make these columns available for the join operation.
Select Subset of Source Data
Any valid Python expression is acceptable to subset the data. Please see Expressions for more details and examples.
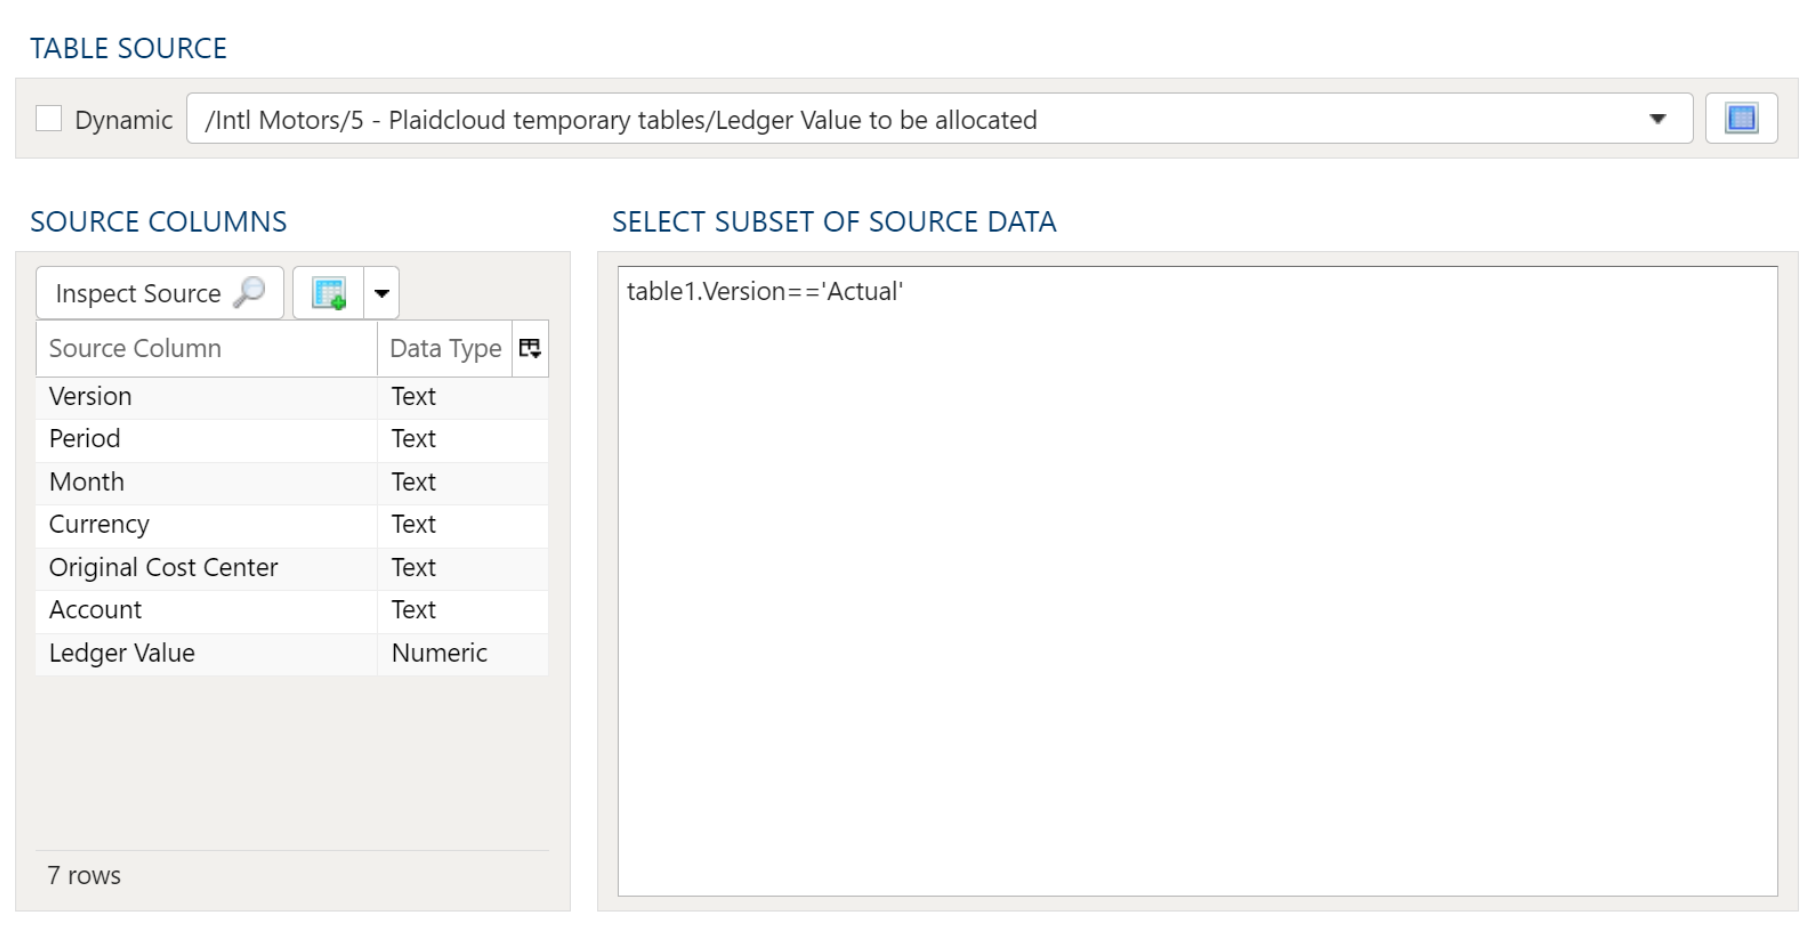
Table Output
Target Table

To establish the target table select either an existing table as the target table using the Target Table dropdown or click on the green "+" sign to create a new table as the target.
Table Creation
When creating a new table you will have the option to either create it as a View or as a Table.
Views:
Views are useful in that the time required for a step to execute is significantly less than when a table is used. The downside of views is they are not a useful for data exploration in the table Details mode.
Tables:
When using a table as the target a step will take longer to execute but data exploration in the Details mode is much quicker than with a view.
Join Map
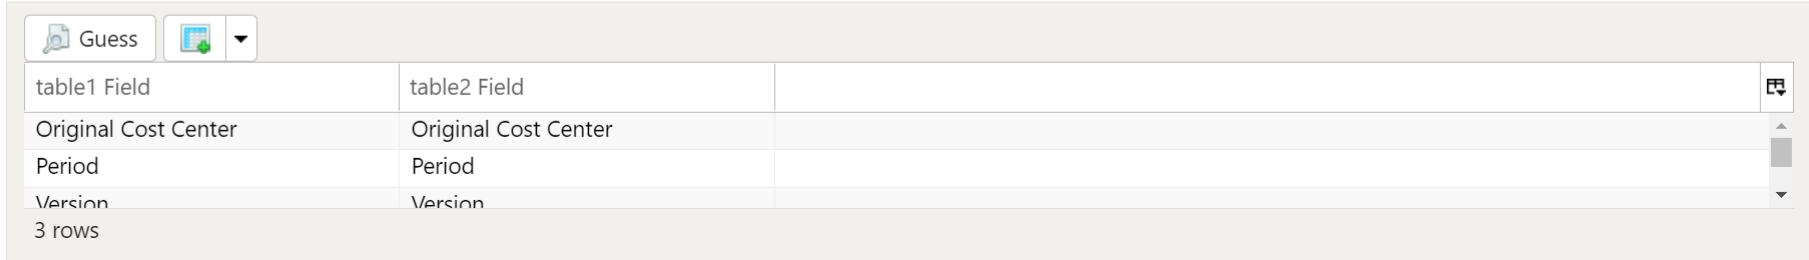
Specify join conditions. Using the Guess button will find all matching columns from both Table 1 as well as Table 2. To add additional columns manually, right click anywhere in the section and select either Insert Row or Append Row, to add a row prior to the currently selected row or to add a row at the end, respectively. Then, type the column names to match from Table 1 to Table 2. To remove a field from the Join Map, simply right-click and select Delete.
Target Output Columns
Data Mapper Configuration
The Data Mapper is used to map columns from the source data to the target data table.
Inspection and Populating the Mapper
Using the Inspect Source menu button provides additional ways to map columns from source to target:
- Populate Both Mapping Tables: Propagates all values from the source data table into the target data table. This is done by default.
- Populate Source Mapping Table Only: Maps all values in the source data table only. This is helpful when modifying an existing workflow when source column structure has changed.
- Populate Target Mapping Table Only: Propagates all values into the target data table only.
If the source and target column options aren’t enough, other columns can be added into the target data table in several different ways:
- Propagate All will insert all source columns into the target data table, whether they already existed or not.
- Propagate Selected will insert selected source column(s) only.
- Right click on target side and select Insert Row to insert a row immediately above the currently selected row.
- Right click on target side and select Append Row to insert a row at the bottom (far right) of the target data table.
Deleting Columns
To delete columns from the target data table, select the desired column(s), then right click and select Delete.
Chaging Column Order
To rearrange columns in the target data table, select the desired column(s). You can use either:
- Bulk Move Arrows: Select the desired move option from the arrows in the upper right
- Context Menu: Right clikc and select Move to Top, Move Up, Move Down, or Move to Bottom.
Reduce Result to Distinct Records Only
To return only distinct options, select the Distinct menu option. This will toggle a set of checkboxes for each column in the source. Simply check any box next to the corresponding column to return only distinct results.
Depending on the situation, you may want to consider use of Summarization instead.
The distinct process retains the first unique record found and discards the rest. You may want to apply a sort on the data if it is important for consistency between runs.
Aggregation and Grouping
To aggregate results, select the Summarize menu option. This will toggle a set of select boxes for each column in the target data table. Choose an appropriate summarization method for each column.
- Group By
- Sum
- Min
- Max
- First
- Last
- Count
- Count (including nulls)
- Mean
- Standard Deviation
- Sample Standard Deviation
- Population Standard Deviation
- Variance
- Sample Variance
- Population Variance
- Advanced Non-Group_By
For advanced data mapper usage such as expressions, cleaning, and constants, please see the Advanced Data Mapper Usage
Output Filters
To allow for maximum flexibility, data filters are available on the source data and the target data. For larger data sets, it can be especially beneficial to filter out rows on the source so the remaining operations are performed on a smaller data set.
Select Subset Of Data
This filter type provides a way to filter the inbound source data based on the specified conditions.
Apply Secondary Filter To Result Data
This filter type provides a way to apply a filter to the post-transformed result data based on the specified conditions. The ability to apply a filter on the post-transformed result allows for exclusions based on results of complex calcuations, summarizaitons, or window functions.
Final Data Table Slicing (Limit)
The row slicing capability provides the ability to limit the rows in the result set based on a range and starting point.
Filter Syntax
The filter syntax utilizes Python SQLAlchemy which is the same syntax as other expressions.
View examples and expression functions in the Expressions area.
4.4.2 - Table Append
Description
Used append data to an existing table.
Load Parameters
Source and Target
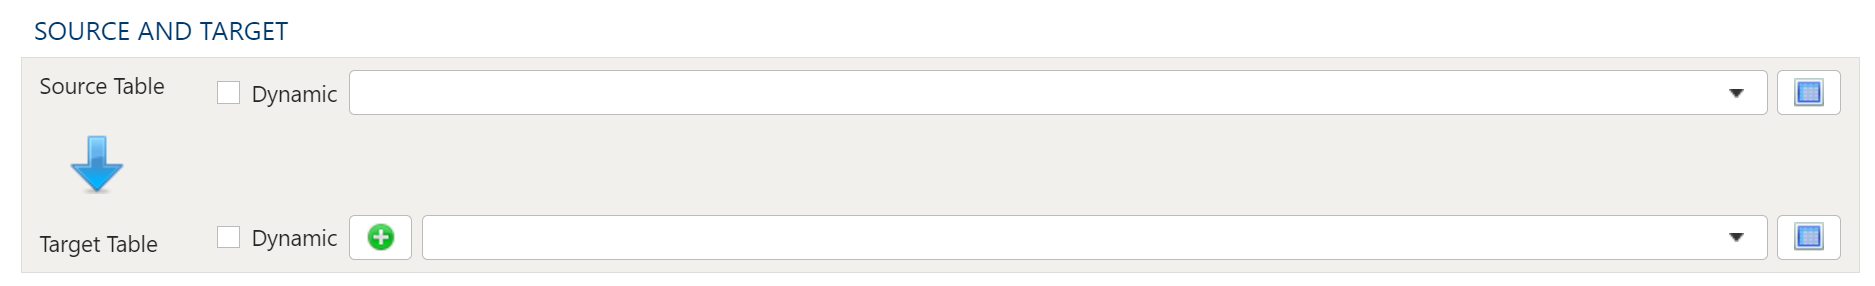
To establish the source and target tables, first select the data table to be extracted from using the Source Table dropdown menu. Next, select an existing table as the target table using the Target Table dropdown.
Table Data Selection
When configuring the Data Mapper the columns in the source table must be mapped to a column in the target table.
Data Mapper Configuration
The Data Mapper is used to map columns from the source data to the target data table.
Inspection and Populating the Mapper
Using the Inspect Source menu button provides additional ways to map columns from source to target:
- Populate Both Mapping Tables: Propagates all values from the source data table into the target data table. This is done by default.
- Populate Source Mapping Table Only: Maps all values in the source data table only. This is helpful when modifying an existing workflow when source column structure has changed.
- Populate Target Mapping Table Only: Propagates all values into the target data table only.
If the source and target column options aren’t enough, other columns can be added into the target data table in several different ways:
- Propagate All will insert all source columns into the target data table, whether they already existed or not.
- Propagate Selected will insert selected source column(s) only.
- Right click on target side and select Insert Row to insert a row immediately above the currently selected row.
- Right click on target side and select Append Row to insert a row at the bottom (far right) of the target data table.
Deleting Columns
To delete columns from the target data table, select the desired column(s), then right click and select Delete.
Chaging Column Order
To rearrange columns in the target data table, select the desired column(s). You can use either:
- Bulk Move Arrows: Select the desired move option from the arrows in the upper right
- Context Menu: Right clikc and select Move to Top, Move Up, Move Down, or Move to Bottom.
Reduce Result to Distinct Records Only
To return only distinct options, select the Distinct menu option. This will toggle a set of checkboxes for each column in the source. Simply check any box next to the corresponding column to return only distinct results.
Depending on the situation, you may want to consider use of Summarization instead.
The distinct process retains the first unique record found and discards the rest. You may want to apply a sort on the data if it is important for consistency between runs.
Aggregation and Grouping
To aggregate results, select the Summarize menu option. This will toggle a set of select boxes for each column in the target data table. Choose an appropriate summarization method for each column.
- Group By
- Sum
- Min
- Max
- First
- Last
- Count
- Count (including nulls)
- Mean
- Standard Deviation
- Sample Standard Deviation
- Population Standard Deviation
- Variance
- Sample Variance
- Population Variance
- Advanced Non-Group_By
For advanced data mapper usage such as expressions, cleaning, and constants, please see the Advanced Data Mapper Usage
Data Filters
To allow for maximum flexibility, data filters are available on the source data and the target data. For larger data sets, it can be especially beneficial to filter out rows on the source so the remaining operations are performed on a smaller data set.
Select Subset Of Data
This filter type provides a way to filter the inbound source data based on the specified conditions.
Apply Secondary Filter To Result Data
This filter type provides a way to apply a filter to the post-transformed result data based on the specified conditions. The ability to apply a filter on the post-transformed result allows for exclusions based on results of complex calcuations, summarizaitons, or window functions.
Final Data Table Slicing (Limit)
The row slicing capability provides the ability to limit the rows in the result set based on a range and starting point.
Filter Syntax
The filter syntax utilizes Python SQLAlchemy which is the same syntax as other expressions.
View examples and expression functions in the Expressions area.
Examples
4.4.3 - Table Clear
Description
Clear the contents of an existing data table without deleting the actual data table. The end result is a data table with 0 rows.
Table Selection
There are two options for selecting the table or in the second option tables to:
The first option is to use the Specific Table dropdown to select the table.
The second is to use the Tables Matching Search option in which you specify the Search Path and Search Text to select the table or tables that match the search criteria. This option is very useful if you have a workflow that creates a series of commonly named tables that that have been saved appending the date.
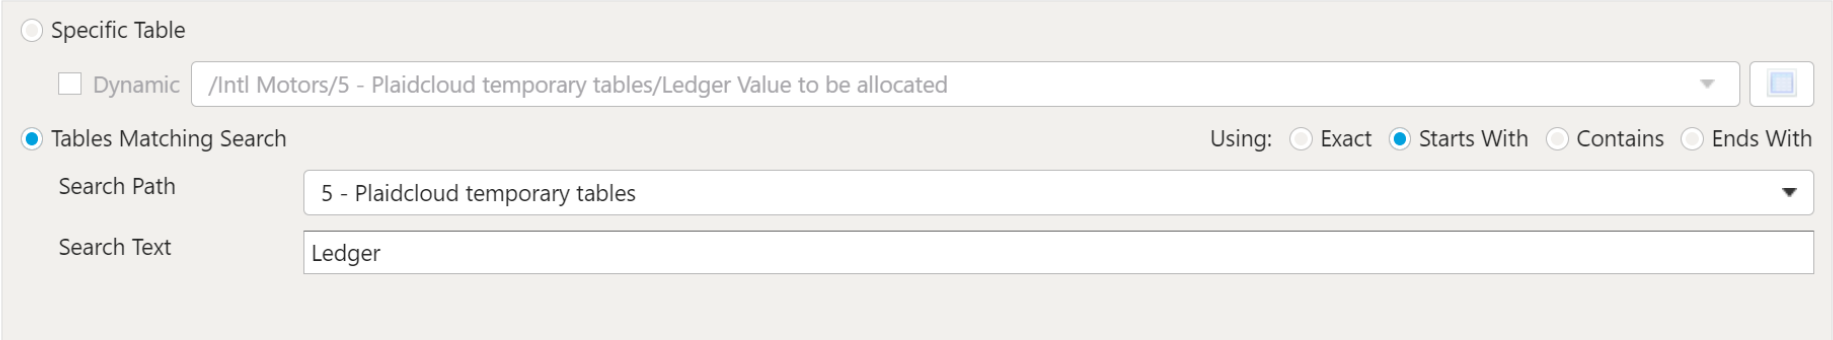
4.4.4 - Table Copy
Description
Create a copy of a data table.
Source and Target
To establish the source and target tables, first select the data table to be extracted from using the Source Table dropdown menu. Next, select either an existing table as the target table using the Target Table dropdown or click on the green "+" sign to create a new table as the target.
Table Creation
When creating a new table you will have the option to either create it as a View or as a Table.
Views:
Views are useful in that the time required for a step to execute is significantly less than when a table is used. The downside of views is they are not a useful for data exploration in the table Details mode.
Tables:
When using a table as the target a step will take longer to execute but data exploration in the Details mode is much quicker than with a view.
When performing the copy, Analyze will first check to see if the target data table already exists. If it does, no action will be performed unless the Allow Overwriting Existing Table checkbox is selected. If this is the case, the target table will be overwritten.
Examples
4.4.5 - Table Cross Join
Description
Use, as you might have expected, to perform a cross join operation on 2 data tables, combining them into a single data table without join key(s).
For more details on cross join methodology, see here: Wikipedia SQL Cross Join
Table Data Selection
Table Source
Specify the source data table by selecting it from the dropdown menu.
Source Columns
Specify any columns to be included here. Selecting the Inspect Source and Populate Source Mapping Table buttons will make these columns available for the join operation.
Select Subset of Source Data
Any valid Python expression is acceptable to subset the data. Please see Expressions for more details and examples.
Table Output
Target Table
To establish the target table select either an existing table as the target table using the Target Table dropdown or click on the green "+" sign to create a new table as the target.
Table Creation
When creating a new table you will have the option to either create it as a View or as a Table.
Views:
Views are useful in that the time required for a step to execute is significantly less than when a table is used. The downside of views is they are not a useful for data exploration in the table Details mode.
Tables:
When using a table as the target a step will take longer to execute but data exploration in the Details mode is much quicker than with a view.
Target Output Columns
Data Mapper Configuration
The Data Mapper is used to map columns from the source data to the target data table.
Inspection and Populating the Mapper
Using the Inspect Source menu button provides additional ways to map columns from source to target:
- Populate Both Mapping Tables: Propagates all values from the source data table into the target data table. This is done by default.
- Populate Source Mapping Table Only: Maps all values in the source data table only. This is helpful when modifying an existing workflow when source column structure has changed.
- Populate Target Mapping Table Only: Propagates all values into the target data table only.
If the source and target column options aren’t enough, other columns can be added into the target data table in several different ways:
- Propagate All will insert all source columns into the target data table, whether they already existed or not.
- Propagate Selected will insert selected source column(s) only.
- Right click on target side and select Insert Row to insert a row immediately above the currently selected row.
- Right click on target side and select Append Row to insert a row at the bottom (far right) of the target data table.
Deleting Columns
To delete columns from the target data table, select the desired column(s), then right click and select Delete.
Chaging Column Order
To rearrange columns in the target data table, select the desired column(s). You can use either:
- Bulk Move Arrows: Select the desired move option from the arrows in the upper right
- Context Menu: Right clikc and select Move to Top, Move Up, Move Down, or Move to Bottom.
Reduce Result to Distinct Records Only
To return only distinct options, select the Distinct menu option. This will toggle a set of checkboxes for each column in the source. Simply check any box next to the corresponding column to return only distinct results.
Depending on the situation, you may want to consider use of Summarization instead.
The distinct process retains the first unique record found and discards the rest. You may want to apply a sort on the data if it is important for consistency between runs.
Aggregation and Grouping
To aggregate results, select the Summarize menu option. This will toggle a set of select boxes for each column in the target data table. Choose an appropriate summarization method for each column.
- Group By
- Sum
- Min
- Max
- First
- Last
- Count
- Count (including nulls)
- Mean
- Standard Deviation
- Sample Standard Deviation
- Population Standard Deviation
- Variance
- Sample Variance
- Population Variance
- Advanced Non-Group_By
For advanced data mapper usage such as expressions, cleaning, and constants, please see the Advanced Data Mapper Usage
Output Filters
To allow for maximum flexibility, data filters are available on the source data and the target data. For larger data sets, it can be especially beneficial to filter out rows on the source so the remaining operations are performed on a smaller data set.
Select Subset Of Data
This filter type provides a way to filter the inbound source data based on the specified conditions.
Apply Secondary Filter To Result Data
This filter type provides a way to apply a filter to the post-transformed result data based on the specified conditions. The ability to apply a filter on the post-transformed result allows for exclusions based on results of complex calcuations, summarizaitons, or window functions.
Final Data Table Slicing (Limit)
The row slicing capability provides the ability to limit the rows in the result set based on a range and starting point.
Filter Syntax
The filter syntax utilizes Python SQLAlchemy which is the same syntax as other expressions.
View examples and expression functions in the Expressions area.
4.4.6 - Table Drop
Description
Drop/delete a data table.
Table Selection
Table Selection
There are two options for selecting the table or in the second option tables to:
The first option is to use the Specific Table dropdown to select the table.
The second is to use the Tables Matching Search option in which you specify the Search Path and Search Text to select the table or tables that match the search criteria. This option is very useful if you have a workflow that creates a series of commonly named tables that that have been saved appending the date.
4.4.7 - Table Extract
Description
Used to extract data from an existing Analyze data table into another data table. Examples include, but are not limited to, the following:
- Sort
- Group
- Summarization
- Filter/Subset Rows
- Drop Extra Columns
- Math Operations
- String Operations
Extract Parameters
Source and Target
To establish the source and target tables, first select the data table to be extracted from using the Source Table dropdown menu. Next, select either an existing table as the target table using the Target Table dropdown or click on the green "+" sign to create a new table as the target.
Table Creation
When creating a new table you will have the option to either create it as a View or as a Table.
Views:
Views are useful in that the time required for a step to execute is significantly less than when a table is used. The downside of views is they are not a useful for data exploration in the table Details mode.
Tables:
When using a table as the target a step will take longer to execute but data exploration in the Details mode is much quicker than with a view.
Table Data Selection
Data Mapper Configuration
The Data Mapper is used to map columns from the source data to the target data table.
Inspection and Populating the Mapper
Using the Inspect Source menu button provides additional ways to map columns from source to target:
- Populate Both Mapping Tables: Propagates all values from the source data table into the target data table. This is done by default.
- Populate Source Mapping Table Only: Maps all values in the source data table only. This is helpful when modifying an existing workflow when source column structure has changed.
- Populate Target Mapping Table Only: Propagates all values into the target data table only.
If the source and target column options aren’t enough, other columns can be added into the target data table in several different ways:
- Propagate All will insert all source columns into the target data table, whether they already existed or not.
- Propagate Selected will insert selected source column(s) only.
- Right click on target side and select Insert Row to insert a row immediately above the currently selected row.
- Right click on target side and select Append Row to insert a row at the bottom (far right) of the target data table.
Deleting Columns
To delete columns from the target data table, select the desired column(s), then right click and select Delete.
Chaging Column Order
To rearrange columns in the target data table, select the desired column(s). You can use either:
- Bulk Move Arrows: Select the desired move option from the arrows in the upper right
- Context Menu: Right clikc and select Move to Top, Move Up, Move Down, or Move to Bottom.
Reduce Result to Distinct Records Only
To return only distinct options, select the Distinct menu option. This will toggle a set of checkboxes for each column in the source. Simply check any box next to the corresponding column to return only distinct results.
Depending on the situation, you may want to consider use of Summarization instead.
The distinct process retains the first unique record found and discards the rest. You may want to apply a sort on the data if it is important for consistency between runs.
Aggregation and Grouping
To aggregate results, select the Summarize menu option. This will toggle a set of select boxes for each column in the target data table. Choose an appropriate summarization method for each column.
- Group By
- Sum
- Min
- Max
- First
- Last
- Count
- Count (including nulls)
- Mean
- Standard Deviation
- Sample Standard Deviation
- Population Standard Deviation
- Variance
- Sample Variance
- Population Variance
- Advanced Non-Group_By
For advanced data mapper usage such as expressions, cleaning, and constants, please see the Advanced Data Mapper Usage
Data Filters
To allow for maximum flexibility, data filters are available on the source data and the target data. For larger data sets, it can be especially beneficial to filter out rows on the source so the remaining operations are performed on a smaller data set.
Select Subset Of Data
This filter type provides a way to filter the inbound source data based on the specified conditions.
Apply Secondary Filter To Result Data
This filter type provides a way to apply a filter to the post-transformed result data based on the specified conditions. The ability to apply a filter on the post-transformed result allows for exclusions based on results of complex calcuations, summarizaitons, or window functions.
Final Data Table Slicing (Limit)
The row slicing capability provides the ability to limit the rows in the result set based on a range and starting point.
Filter Syntax
The filter syntax utilizes Python SQLAlchemy which is the same syntax as other expressions.
View examples and expression functions in the Expressions area.
Examples
4.4.8 - Table Faker
Description
Table Faker generates fake data.
Address
| Generator | Optional Arguments | | Building Number | | | City | | | City Suffix | | | Country | | | Country Code | “representation”=”alpha-2” | | Full Address | | | Latitude | | | Longitude | | | Military DPO | | | Postal Code | | | Postal Code Plus 4 | | | State | | | State Abbreviation | | | Street Address | | | Street Name | | | Street Suffix | |
Automotive
| Generator | Optional Arguments | | License Plate | |
Barcode
| Generator | Optional Arguments | | EAN13 | | | EAN8 | |
Colors
| Generator | Optional Arguments | | Color Name | | | Hex Color | | | RGB Color | | | RGB CSS Color | | | Safe Color Name | | | Safe Hex Color | |
Company
| Generator | Optional Arguments | | Company Catch Phrase | | | Company Name | | | Company Suffix | |
Credit Card
| Generator | Optional Arguments | | Expriration Date | “start”=”now”“end”=”+10y”## ‘12/20’ | | Full | “card_type”=null | | Number | “card_type”=null | | Provider | “card_type”=null | | Security Code | “card_type”=null |
Currency
| Generator | Optional Arguments | | Code | |
Date Time
| Generator | Optional Arguments | | AM/PM | | | Century | | | Date | “pattern”:”%Y-%m-%d”“end_datetime”:null | | Date Time | “tzinfo”:null“end_datetime”=null | | Date Time this Century | “before_now”=true“after_now”=false“tzinfo”=null | | Date Time this Decade | “before_now”=true“after_now”=false“tzinfo”=null | | Date Time this Month | “before_now”=true“after_now”=false“tzinfo”=null | | Date Time this Year | “before_now”=true“after_now”=false“tzinfo”=null | | Day of Month | | | Day of Week | | | ISO8601 Date Time | “tzinfo”=null“end_datetime”=null | | Month | | | Month Name | | | Past Date (Last 30 Days) | “start_date”=”-30d”“tzinfo”=null | | Timezone | | | Unix Time | “end_datetime”=null“start_datetime”=null | | Year | |
File
| Generator | Optional Arguments | | File Extension | “category”=null | | File Name | “category”=null“extension”=null | | File Path | “depth”=”1”“category”=null“extension”=null | | Mime Type | “category”=null |
Internet
| Generator | Optional Arguments | | Company Email | | | Domain Name | | | Domain Word | | | Email | | | Free Email | | | Free Email Domain | | | Image URL | “width”=null“height”=null | | IPv4 | “network”=false“address_class”=”no”“private”=null | | IPv6 | “network”=false | | MAC Address | | | Safe Email | | | Slug | | | TLD | | | URI | | | URL | “schemes”=null | | URL Extension | | | URL Page | | | User Name | |
ISBN
| Generator | Optional Arguments | | ISBN10 | “eparator”=”-“ | | ISBN13 | “eparator”=”-“ |
Job
| Generator | Optional Arguments | | Job Name | |
Lorem
| Generator | Optional Arguments | | Paragraph | “nb_sentences”=”3”“variable_nb_sentences”=true“ext_word_list”=null | | Paragraphs | “nb”=”3”“ext_word_list”=null | | Sentence | “nb_words”=”6”“variable_nb_words”=true“ext_word_list”=null | | Sentences | “nb”=”3”“ext_word_list”=null | | Text | “max_nb_chars”=”200”“ext_word_list”=null | | Word | “ext_word_list”=null | | Words | “nb”=”3”“ext_word_list”=null |
Misc
| Generator | Optional Arguments | | Binary | “length”=”1048576” | | Boolean | “chance_of_getting_true”=”50” | | Null Boolean | | | Locale | | | Language Code | | | MD5 | “raw_output”=false | | Password | “length”=”10”“special_chars”=true“digits”=true“upper_case”=true“lower_case”=true | | Random String | | | SHA1 | “raw_output”=false | | SHA256 | “raw_output”=false | | UUID4 | |
Numeric
| Generator | Optional Arguments | | Big Serial (Auto Increment) | | | Random Float | | | Random Float in Range | | | Random Integer | | | Random Integer in Range | | | Random Numeric | | | Random Percentage (0 – 1) | | | Random Percentage (0 – 100) | | | Serial (Auto Increment) | |
Person
| Generator | Optional Arguments | | First Name | | | First Name Female | | | First Name Male | | | Full Name | | | Full Name Female | | | Full Name Male | | | Last Name | | | Last Name Female | | | Last Name Male | | | Prefix | | | Prefix Female | | | Prefix Male | | | Suffix | | | Suffix Female | | | Suffix Male | |
Phone
| Generator | Optional Arguments | | Phone Number | | | ISDN | |
Tax
| Generator | Optional Arguments | | EIN | | | Full SSN | | | ITIN | |
User Agent
| Generator | Optional Arguments | | Chrome | “version_from”=”13”“version_to”=”63”“build_from”=”800”“build_to”=”899” | | Firefox | | | Full User Agent | | | Internet Explorer | | | Linux Platform Token | | | Linux Processor | | | Mac Platform Token | | | Mac Processor | | | Opera | | | Safari | | | Windows Platform Token | |
Special Generators
While these two generators do not have arguments, the options they provide act similarly to arguments.
Pattern Generator:
| Number | Format | Output | Description | | 3.1415926 | {:.2f} | 3.14 | 2 decimal places | | 3.1415926 | {:+.2f} | +3.14 | 2 decimal places with sign | | -1 | {:+.2f} | -1.00 | 2 decimal places with sign | | 2.71828 | {:.0f} | 3 | No decimal places | | 5 | {:0>2d} | 05 | Pad number with zeros (left padding, width 2) | | 5 | {:x<4d} | 5xxx | Pad Number with x’s (right padding, width 4) | | 10 | {:x<4d} | 10xx | Pad number with x’s (right padding, width 4) | | 1000000 | {:,} | 1,000,000 | Number format with comma separator | | 0.25 | {:.2%} | 25.00% | Format percentage | | 1000000000 | {:.2e} | 1.00e+09 | Exponent notation | | 13 | {:10d} | 13 | Right aligned (default, width 10) | | 13 | {:<10d} | 13 | Left aligned (width 10) | | 13 | {:^10d} | 13 | Center aligned (width 10) |
Random Choice:
In order to provide the options for random choice, simply put your options in quotes and seperate each option with a comma. So a string of random choice options would appear like this: “x”,”y”,”z”
Here, the “Key Word Args/Pattern/Choices” column of the “pattern” row contains a sentence with several references. The first reference equation ( {percentage0-100:.2f}% ) points to the “percentage0-100” row which will generate a random equation. Therefore, the random percentage produced by the “percentage0-100” row will be automatically inserted into the sentence. The reference equation {first_name} points to the row titled “first_name” which will randomly generate a first name, and this name will be automatically inserted into the sentence. The last reference equation ( {randomn_choice} ) operates the same as the other two.
With this, when the pattern generator is run, you will recieve the following results.
4.4.9 - Table In-Place Delete
Description
Performs a delete on the table using the specified filter conditions. The operation is performed on the designated table directly so no additional tables are created. Only the rows that meet the filter criteria are deleted. This may be an effective approach when encountering concerns related to data size.
Delete Parameters
Select the Source table for deleting from the dropdown list. This list includes all Project and Workflow data tables.
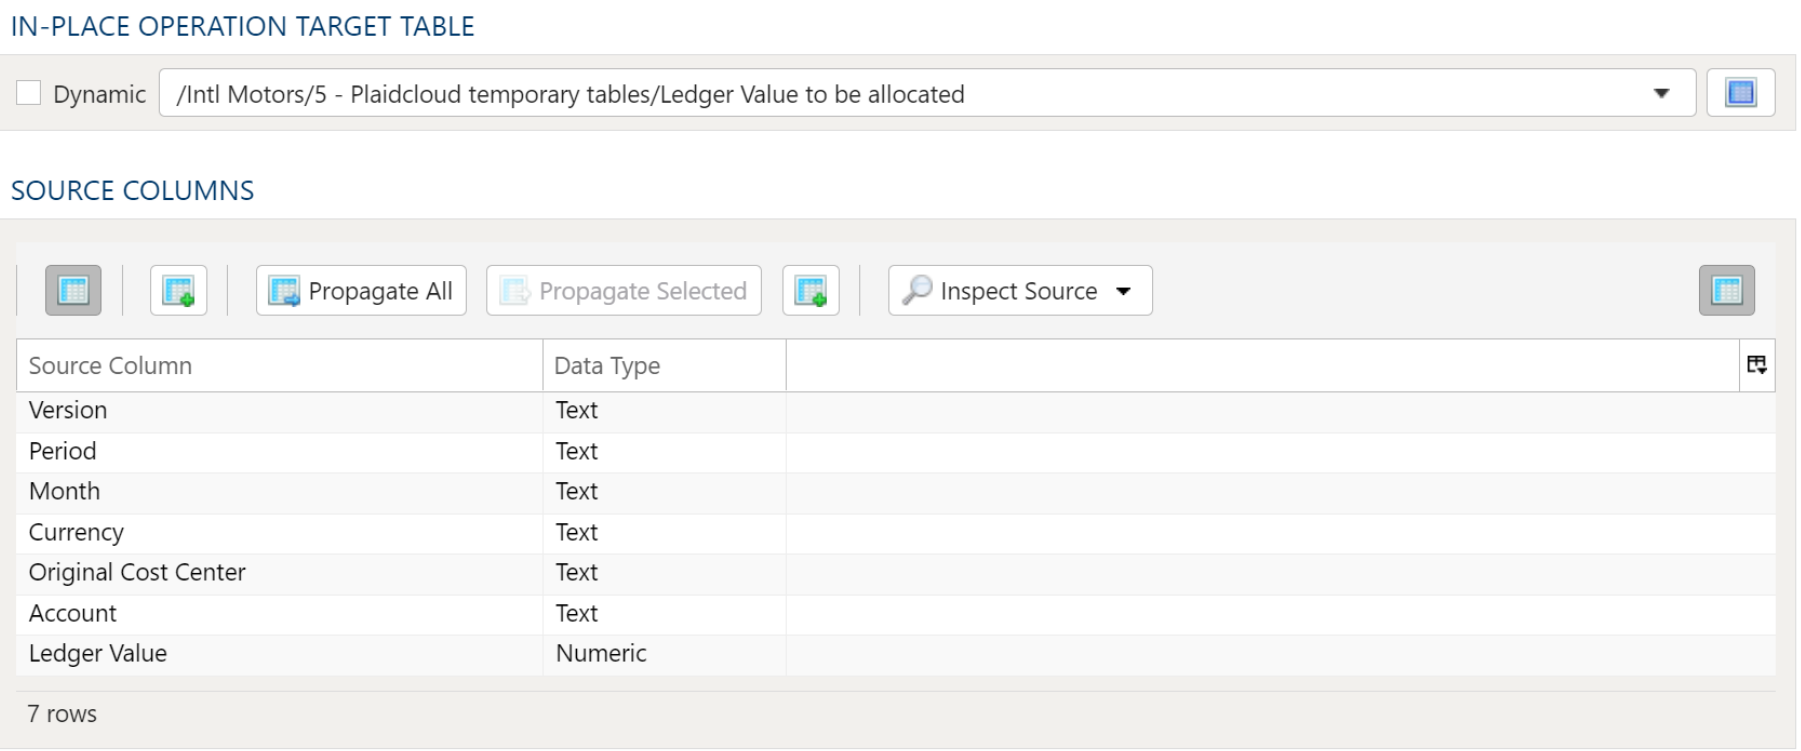
Data Filters for Delete
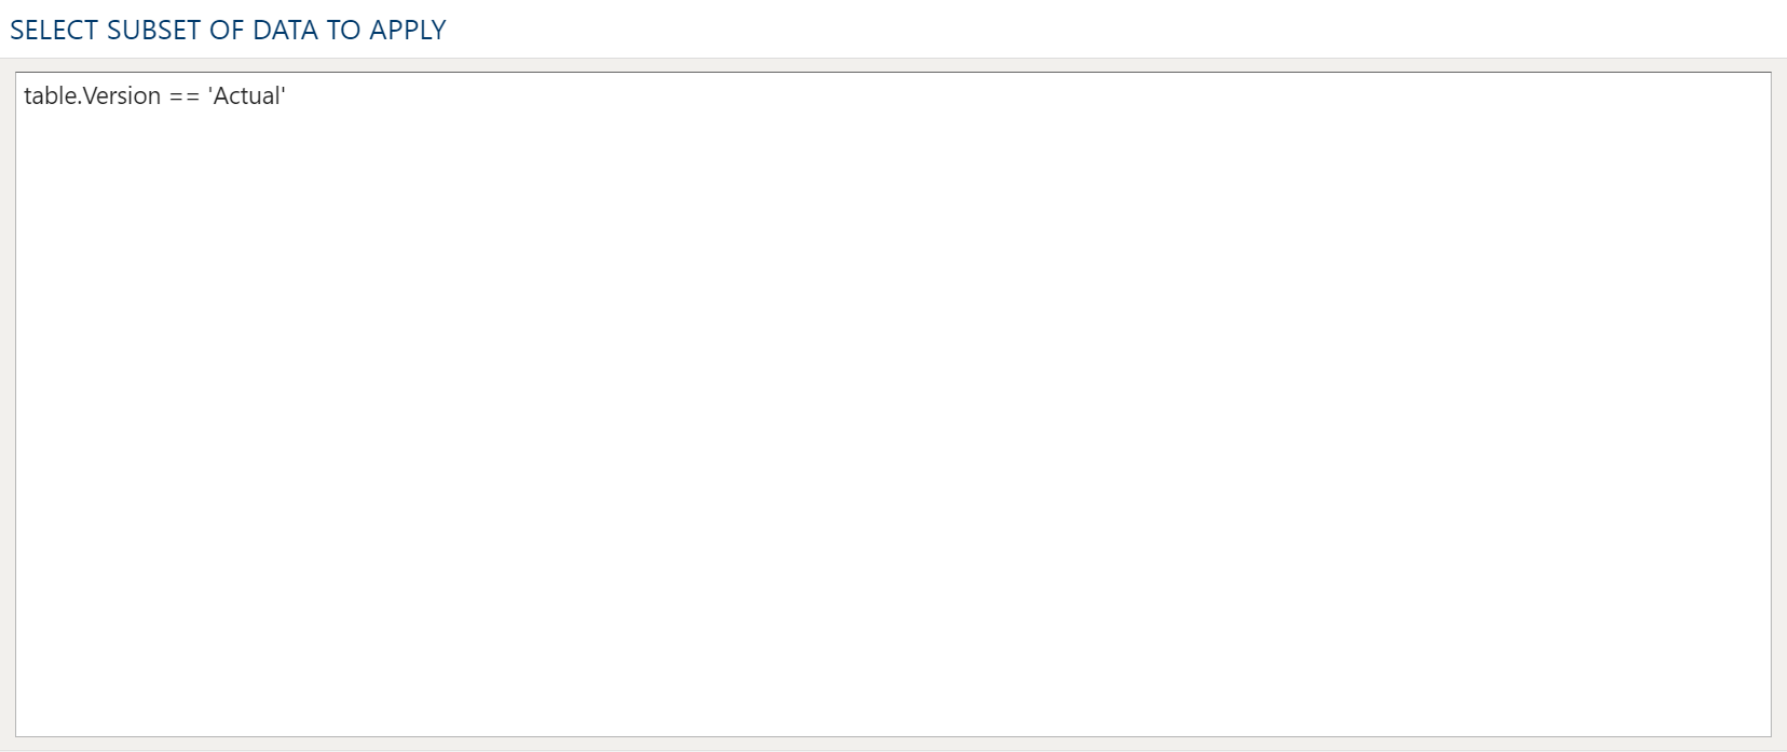
Examples
4.4.10 - Table In-Place Update
Description
Performs an update on the table using the specified filter conditions and value settings. The operation is performed directly on the designated table, so no additional tables are created. This may be an effective approach when concerns of data size are encountered.
Table Selection
Select the Source table for updating from the dropdown list. This list includes all Project and Workflow data tables.
Examples
In this example the Account will be set to 41000 when the Version is equal to "Actual" in "Ledger Value to be allocated".
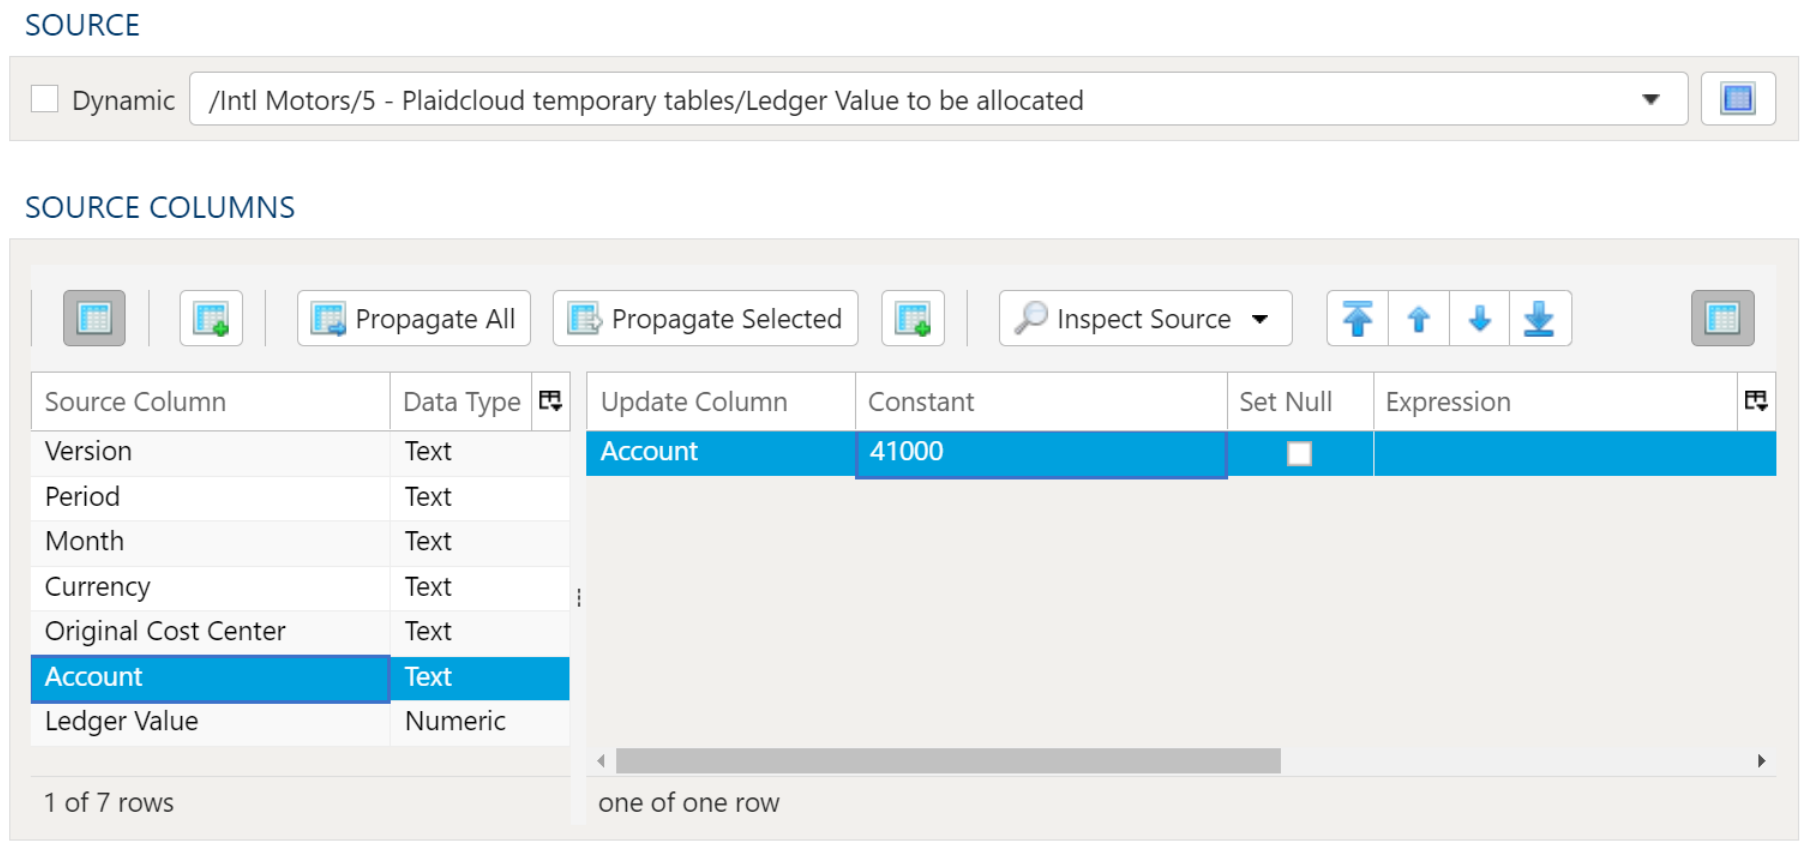
4.4.11 - Table Inner Join
Description
Use, as you might have expected, to perform an inner join operation on 2 data tables, combining them into a single data table based upon the specified join key(s).
For more details on inner join methodology, see here: Wikipedia SQL Inner Join
Table Data Selection
Table Source
Specify the source data table by selecting it from the dropdown menu.
Source Columns
Specify any columns to be included here. Selecting the Inspect Source and Populate Source Mapping Table buttons will make these columns available for the join operation.
Select Subset of Source Data
Any valid Python expression is acceptable to subset the data. Please see Expressions for more details and examples.
Table Output
Target Table
To establish the target table select either an existing table as the target table using the Target Table dropdown or click on the green "+" sign to create a new table as the target.
Table Creation
When creating a new table you will have the option to either create it as a View or as a Table.
Views:
Views are useful in that the time required for a step to execute is significantly less than when a table is used. The downside of views is they are not a useful for data exploration in the table Details mode.
Tables:
When using a table as the target a step will take longer to execute but data exploration in the Details mode is much quicker than with a view.
Join Map
Specify join conditions. Using the Guess button will find all matching columns from both Table 1 as well as Table 2. To add additional columns manually, right click anywhere in the section and select either Insert Row or Append Row, to add a row prior to the currently selected row or to add a row at the end, respectively. Then, type the column names to match from Table 1 to Table 2. To remove a field from the Join Map, simply right-click and select Delete.
Target Output Columns
Data Mapper Configuration
The Data Mapper is used to map columns from the source data to the target data table.
Inspection and Populating the Mapper
Using the Inspect Source menu button provides additional ways to map columns from source to target:
- Populate Both Mapping Tables: Propagates all values from the source data table into the target data table. This is done by default.
- Populate Source Mapping Table Only: Maps all values in the source data table only. This is helpful when modifying an existing workflow when source column structure has changed.
- Populate Target Mapping Table Only: Propagates all values into the target data table only.
If the source and target column options aren’t enough, other columns can be added into the target data table in several different ways:
- Propagate All will insert all source columns into the target data table, whether they already existed or not.
- Propagate Selected will insert selected source column(s) only.
- Right click on target side and select Insert Row to insert a row immediately above the currently selected row.
- Right click on target side and select Append Row to insert a row at the bottom (far right) of the target data table.
Deleting Columns
To delete columns from the target data table, select the desired column(s), then right click and select Delete.
Chaging Column Order
To rearrange columns in the target data table, select the desired column(s). You can use either:
- Bulk Move Arrows: Select the desired move option from the arrows in the upper right
- Context Menu: Right clikc and select Move to Top, Move Up, Move Down, or Move to Bottom.
Reduce Result to Distinct Records Only
To return only distinct options, select the Distinct menu option. This will toggle a set of checkboxes for each column in the source. Simply check any box next to the corresponding column to return only distinct results.
Depending on the situation, you may want to consider use of Summarization instead.
The distinct process retains the first unique record found and discards the rest. You may want to apply a sort on the data if it is important for consistency between runs.
Aggregation and Grouping
To aggregate results, select the Summarize menu option. This will toggle a set of select boxes for each column in the target data table. Choose an appropriate summarization method for each column.
- Group By
- Sum
- Min
- Max
- First
- Last
- Count
- Count (including nulls)
- Mean
- Standard Deviation
- Sample Standard Deviation
- Population Standard Deviation
- Variance
- Sample Variance
- Population Variance
- Advanced Non-Group_By
For advanced data mapper usage such as expressions, cleaning, and constants, please see the Advanced Data Mapper Usage
Output Filters
To allow for maximum flexibility, data filters are available on the source data and the target data. For larger data sets, it can be especially beneficial to filter out rows on the source so the remaining operations are performed on a smaller data set.
Select Subset Of Data
This filter type provides a way to filter the inbound source data based on the specified conditions.
Apply Secondary Filter To Result Data
This filter type provides a way to apply a filter to the post-transformed result data based on the specified conditions. The ability to apply a filter on the post-transformed result allows for exclusions based on results of complex calcuations, summarizaitons, or window functions.
Final Data Table Slicing (Limit)
The row slicing capability provides the ability to limit the rows in the result set based on a range and starting point.
Filter Syntax
The filter syntax utilizes Python SQLAlchemy which is the same syntax as other expressions.
View examples and expression functions in the Expressions area.
Examples
Join Automobile Manufacturers with Models
In this example, consider the following source data tables. First is a list of automobile manufacturers.
| Mfg_ID | Manufacturer |
|---|---|
| 1 | Aston Martin |
| 2 | Porsche |
| 3 | Lamborghini |
| 4 | Ferrari |
| 5 | Koenigsegg |
Next is a list of automobile models with a manufacturer ID. Note that there are several models with no manufacturer.
| ModelName | Mfg_ID |
|---|---|
| Aventador | 3 |
| Countach | 3 |
| DBS | 1 |
| Enzo | 4 |
| One-77 | 1 |
| Optimus Prime | |
| Batmobile | |
| Agera | 5 |
| Lightning McQueen |
To get a list of models by manufacturer, it makes sense to join on Mfg_ID.
First, specify parameters for Table 1 Data Selection. The source data table is selected and all columns are listed.
Next, specify parameters for Table 2 Data Selection. Once again, the source data table is selected and all columns are listed.
Finally, the join conditions are set in the Table Output tab. Using the Guess button, Analyze properly identifies the Mfg_ID column to use as the Join Key. Lastly, the
Target Output Columns are specified automatically using the Propagate button. This effectively includes all columns from all tables, with all join columns included only a single time. Note that the columns are sorted alphabetically, first by Manufacturer and next by ModelName.
As expected, the final output only includes values which had a match in both tables. As such, Porsche does not show up because it had no models. Likewise, the
Batmobile had no manufacturer (it was a custom job), so it’s not included.
4.4.12 - Table Lookup
Description
If you are a regular user of the vlookup function in Microsoft Excel, the Table Lookup transform should feel very familiar. It’s used to perform essentially the same function. Unlike the Microsoft Excel version, the PlaidCloud Analyze Table Lookup transform offers greater flexibility, especially allowing for matching on and returning multiple columns.
Table Data Selection
Table Source
Specify the source data table by selecting it from the dropdown menu.
Source Columns
Specify any columns to be included here. Selecting the Inspect Source and Populate Source Mapping Table buttons will make these columns available for the join operation.
Select Subset of Source Data
Any valid Python expression is acceptable to subset the data. Please see Expressions for more details and examples.
Table Output
Target Table
To establish the target table select either an existing table as the target table using the Target Table dropdown or click on the green "+" sign to create a new table as the target.
Table Creation
When creating a new table you will have the option to either create it as a View or as a Table.
Views:
Views are useful in that the time required for a step to execute is significantly less than when a table is used. The downside of views is they are not a useful for data exploration in the table Details mode.
Tables:
When using a table as the target a step will take longer to execute but data exploration in the Details mode is much quicker than with a view.
Join Map
Specify join conditions. Using the Guess button will find all matching columns from both Table 1 as well as Table 2. To add additional columns manually, right click anywhere in the section and select either Insert Row or Append Row, to add a row prior to the currently selected row or to add a row at the end, respectively. Then, type the column names to match from Table 1 to Table 2. To remove a field from the Join Map, simply right-click and select Delete.
Target Output Columns
Data Mapper Configuration
The Data Mapper is used to map columns from the source data to the target data table.
Inspection and Populating the Mapper
Using the Inspect Source menu button provides additional ways to map columns from source to target:
- Populate Both Mapping Tables: Propagates all values from the source data table into the target data table. This is done by default.
- Populate Source Mapping Table Only: Maps all values in the source data table only. This is helpful when modifying an existing workflow when source column structure has changed.
- Populate Target Mapping Table Only: Propagates all values into the target data table only.
If the source and target column options aren’t enough, other columns can be added into the target data table in several different ways:
- Propagate All will insert all source columns into the target data table, whether they already existed or not.
- Propagate Selected will insert selected source column(s) only.
- Right click on target side and select Insert Row to insert a row immediately above the currently selected row.
- Right click on target side and select Append Row to insert a row at the bottom (far right) of the target data table.
Deleting Columns
To delete columns from the target data table, select the desired column(s), then right click and select Delete.
Chaging Column Order
To rearrange columns in the target data table, select the desired column(s). You can use either:
- Bulk Move Arrows: Select the desired move option from the arrows in the upper right
- Context Menu: Right clikc and select Move to Top, Move Up, Move Down, or Move to Bottom.
Reduce Result to Distinct Records Only
To return only distinct options, select the Distinct menu option. This will toggle a set of checkboxes for each column in the source. Simply check any box next to the corresponding column to return only distinct results.
Depending on the situation, you may want to consider use of Summarization instead.
The distinct process retains the first unique record found and discards the rest. You may want to apply a sort on the data if it is important for consistency between runs.
Aggregation and Grouping
To aggregate results, select the Summarize menu option. This will toggle a set of select boxes for each column in the target data table. Choose an appropriate summarization method for each column.
- Group By
- Sum
- Min
- Max
- First
- Last
- Count
- Count (including nulls)
- Mean
- Standard Deviation
- Sample Standard Deviation
- Population Standard Deviation
- Variance
- Sample Variance
- Population Variance
- Advanced Non-Group_By
For advanced data mapper usage such as expressions, cleaning, and constants, please see the Advanced Data Mapper Usage
Output Filters
To allow for maximum flexibility, data filters are available on the source data and the target data. For larger data sets, it can be especially beneficial to filter out rows on the source so the remaining operations are performed on a smaller data set.
Select Subset Of Data
This filter type provides a way to filter the inbound source data based on the specified conditions.
Apply Secondary Filter To Result Data
This filter type provides a way to apply a filter to the post-transformed result data based on the specified conditions. The ability to apply a filter on the post-transformed result allows for exclusions based on results of complex calcuations, summarizaitons, or window functions.
Final Data Table Slicing (Limit)
The row slicing capability provides the ability to limit the rows in the result set based on a range and starting point.
Filter Syntax
The filter syntax utilizes Python SQLAlchemy which is the same syntax as other expressions.
View examples and expression functions in the Expressions area.
Examples
Lookup Product Dimension Information
In this example, the modeler needs information from the product dimension table to make sense of the order fact table. As such, the Import Order Fact table is selected as the Source Table. The Import Product Dim table contains the desired lookup information, so it’s selected as the Lookup Table Source. Although available, no filters are applied to the lookup data table (nor any other data tables, for that matter).
In the Table Data Selection section, all columns are mapped from the source data table to the target data table.
No Data Filters are applied to either source or target data.
Lastly, the source data table is matched to the lookup data table using the Product_ID field found in each table. Only the Product_Description and Unit_Cost columns are appended to the target data table, with Unit_Cost being renamed to Retail_Unit_Cost in the process.
In the resulting target data table, the Product_Description and Retail_Unit_Cost columns have been added, based on matching values in the Product_ID column.
4.4.13 - Table Melt
Description
Used to convert short, wide data tables into long, narrow data tables. Selected columns are transposed, with the column names converted into values across multiple rows.
Perhaps the easiest example to understand is to think of a data table with months listed as column headers:
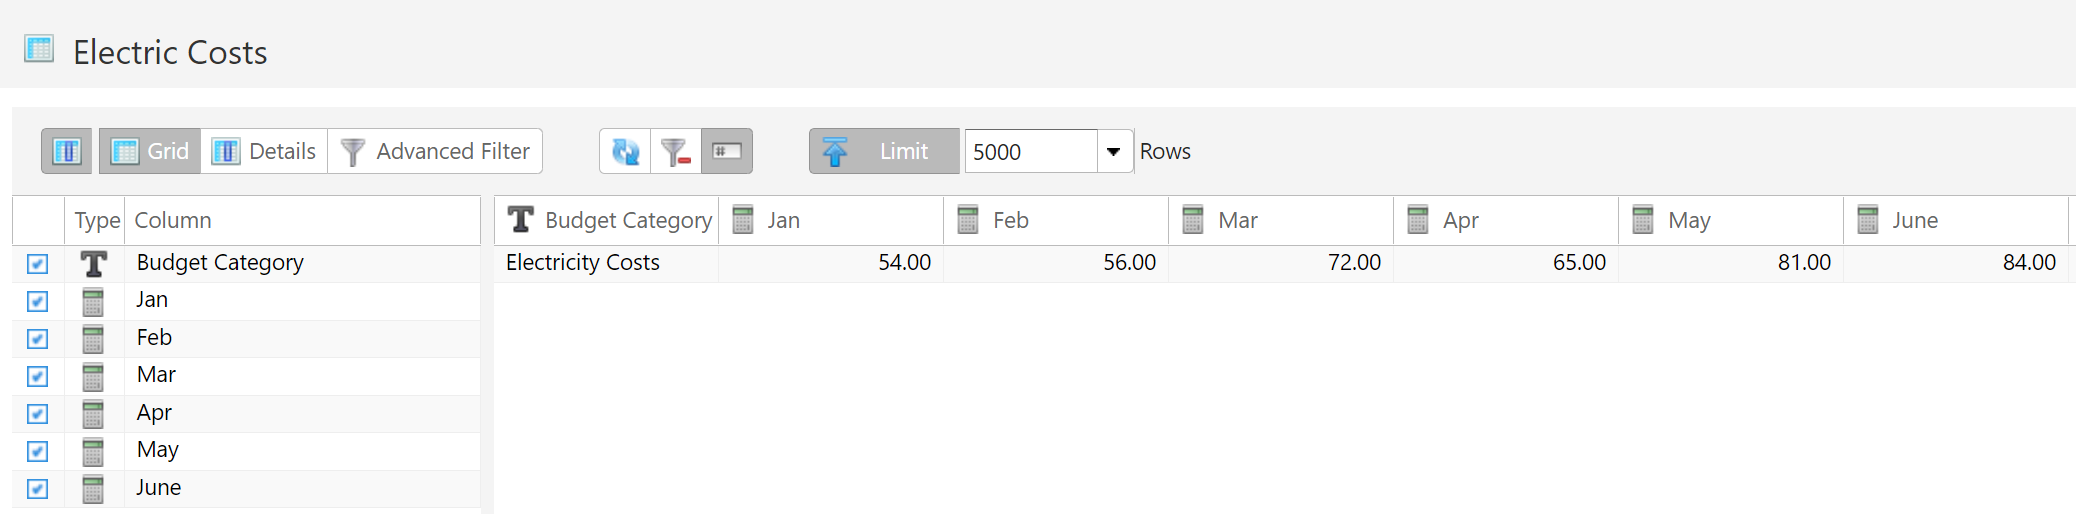
Melting this data table would convert all of the month columns into rows.
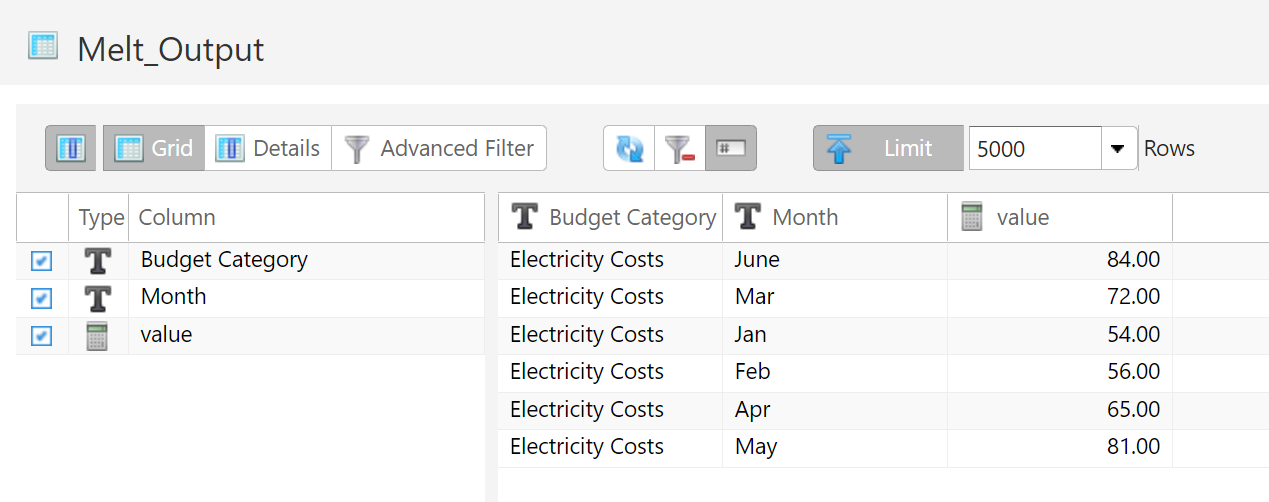
By specifying which columns to transpose and which columns to leave alone, this becomes a powerful tool. Making this conversion in other ETL tools could require a dozen more steps.
Source and Target Parameters
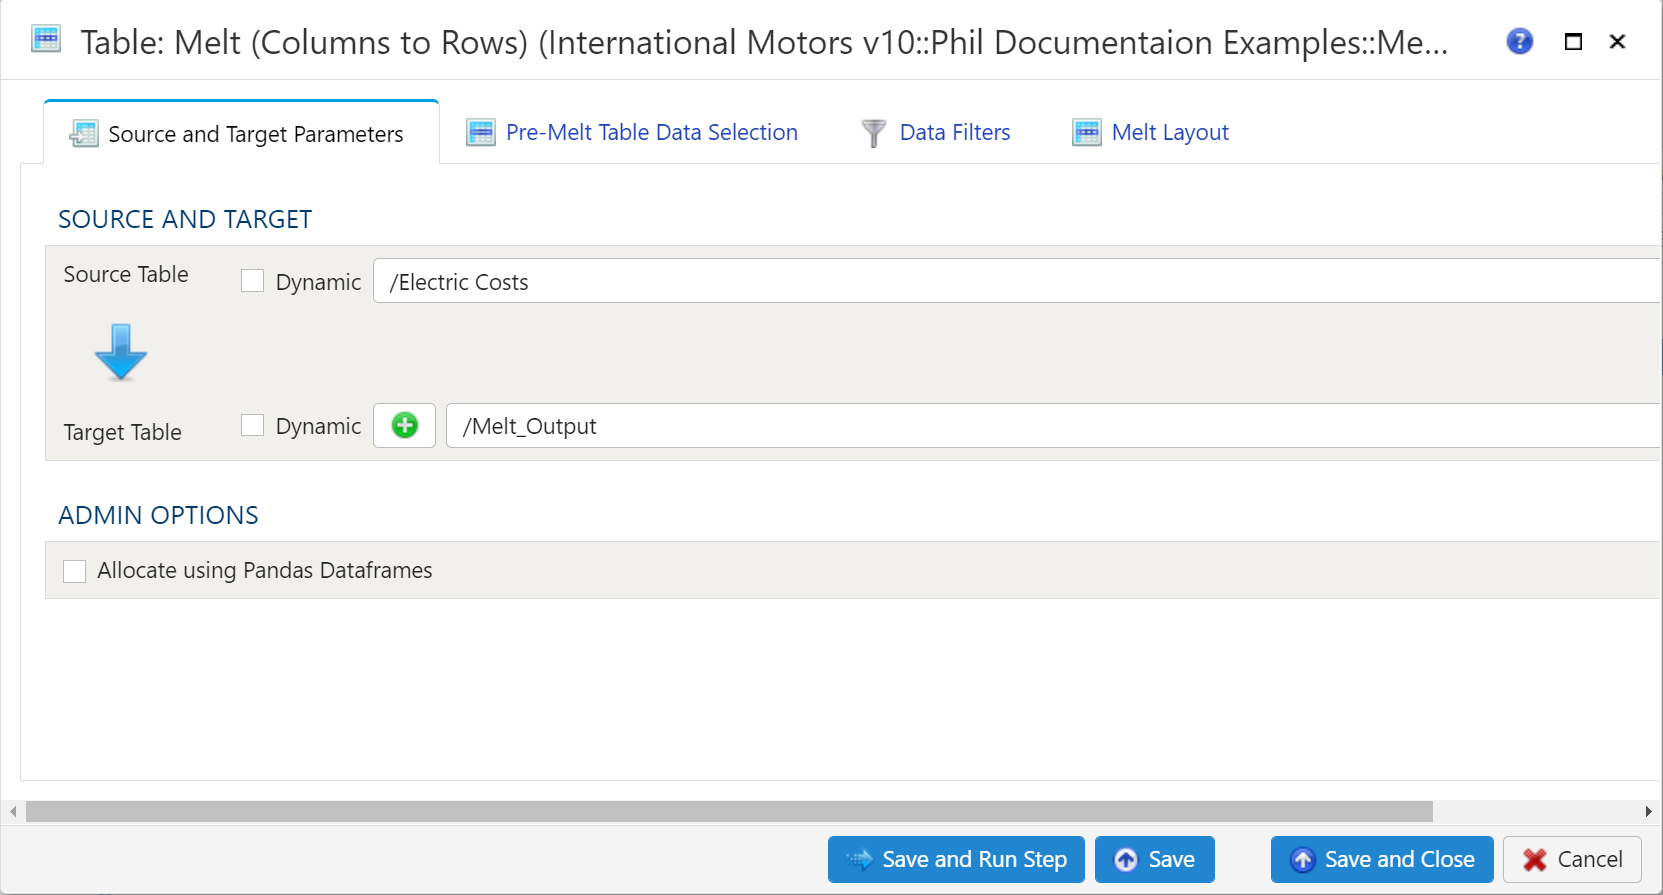
Source and Target
To establish the source and target, first select the data table to be extracted from the Source Table dropdown menu.
Target Table
To establish the target table select either an existing table as the target table using the Target Table dropdown or click on the green "+" sign to create a new table as the target.
Table Creation
When creating a new table you will have the option to either create it as a View or as a Table.
Views:
Views are useful in that the time required for a step to execute is significantly less than when a table is used. The downside of views is they are not a useful for data exploration in the table Details mode.
Tables:
When using a table as the target a step will take longer to execute but data exploration in the Details mode is much quicker than with a view.
Pre-Melt Table Data Selection
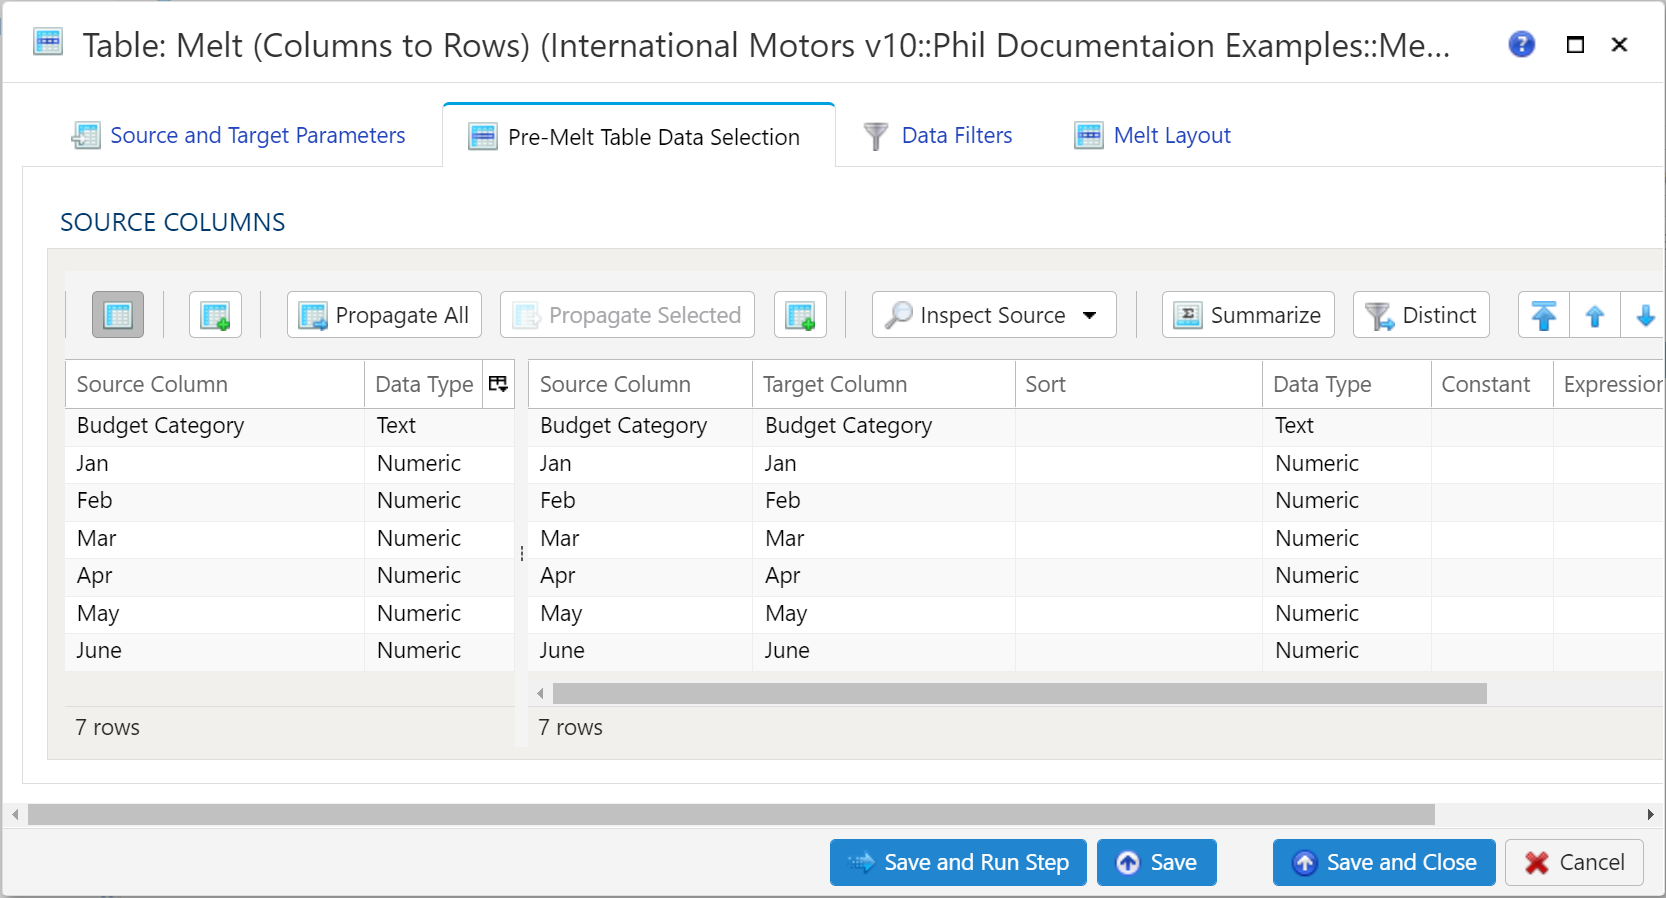
This section is a bit different from the standard Table Data Selection. Basically this is used to specify which columns are to be used in the Melt operation. This includes ID columns and Variable/Value columns.
For more details regarding Table Data Selection, see details here: Table Data Selection
Data Filters
To allow for maximum flexibility, data filters are available on the source data and the target data. For larger data sets, it can be especially beneficial to filter out rows on the source so the remaining operations are performed on a smaller data set.
Select Subset of Source Data
Any valid Python expression is acceptable to subset the data. Please see Expressions
for more details and examples.
Apply Secondary Filter To Result Data
Any valid Python expression is acceptable to subset the data. Please see Expressions for more details and examples
Final Data Table Slicing (Limit)
To limit the data, simply check the Apply Row Slicer box and then specify the following:
- Initial Rows to Skip: Rows of data to skip (column header row is not included in count)
- End at Row: Last row of data to include. This is different from simply counting rows at the end to drop
Melt Layout
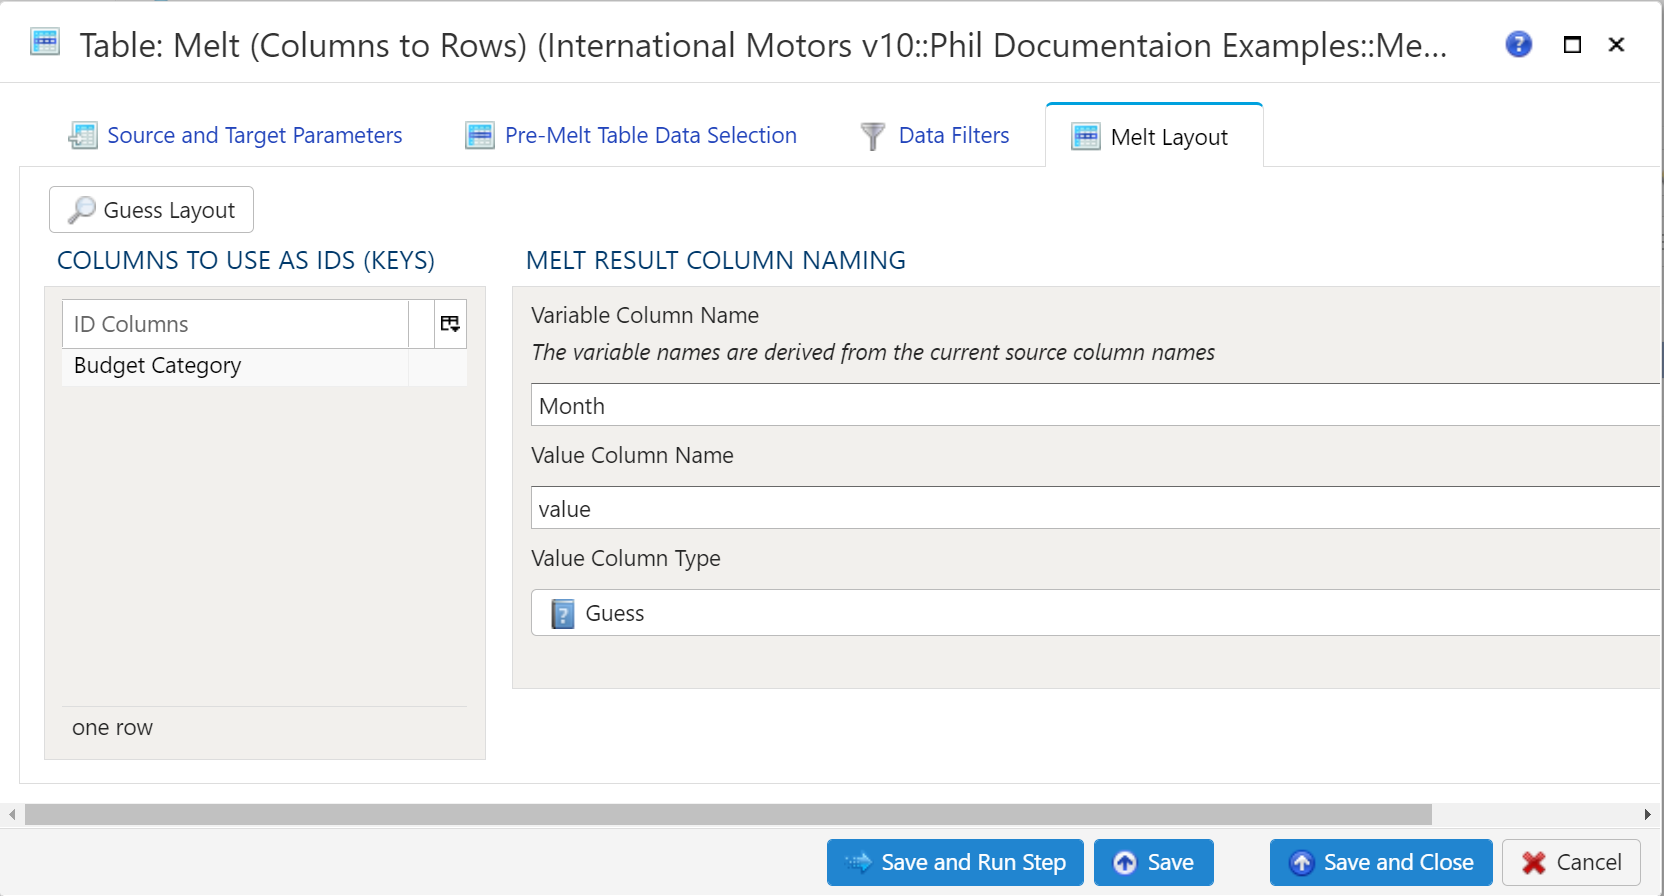
There is a Guess Layout button available to allow Analyze a first crack at specifying ID columns. By default, all text (data type of String) columns are placed in the Keys section. Numeric columns are not placed into Keys by default, but they are allowed to be there based on the model’s needs.
Columns to Use as IDs (Keys)
ID columns are the columns which remain in tact. These columns are effectively repeated for every instance of a variable/value combination. For a monthly table, this would result in 12 repetitions of ID columns.
ID columns can be added automatically or manually. To add the columns automatically, use the aforementioned Guess Layout button. To add additional columns manually, right click anywhere in the section and select either Insert Row or Append Row, to add a row prior to the currently selected row or to add a row at the end, respectively. Then, type the column name to use as an ID.
To remove a field from the IDs, simply right-click and select Delete.
Melt Result Column Naming
There are 2 values to specify. Both of these values will become column names in the target data table.
- Variable Column Name: As specified in the transform, The variable names are derived from the current source column names. Essentially, specify a column name which will represent the data originally represented in the source data table columns.
- Value Column Name: Specify a column name to represent the data represented within the source data table. Typically this will be a numerical unit: Dollars, Pounds, Degrees, Percent, etc.
Examples
In the abouve documentation.
4.4.14 - Table Outer Join
Description
Use, as you might have expected, to perform a full outer join operation on 2 data tables, combining them into a single data table based upon the join key(s) specified.
For more details on outer join methodology, see here: Wikipedia SQL Full Outer Join
Table Data Selection
Table Source
Specify the source data table by selecting it from the dropdown menu.
Source Columns
Specify any columns to be included here. Selecting the Inspect Source and Populate Source Mapping Table buttons will make these columns available for the join operation.
Select Subset of Source Data
Any valid Python expression is acceptable to subset the data. Please see Expressions for more details and examples.
Table Output
Target Table
To establish the target table select either an existing table as the target table using the Target Table dropdown or click on the green "+" sign to create a new table as the target.
Table Creation
When creating a new table you will have the option to either create it as a View or as a Table.
Views:
Views are useful in that the time required for a step to execute is significantly less than when a table is used. The downside of views is they are not a useful for data exploration in the table Details mode.
Tables:
When using a table as the target a step will take longer to execute but data exploration in the Details mode is much quicker than with a view.
Join Map
Specify join conditions. Using the Guess button will find all matching columns from both Table 1 as well as Table 2. To add additional columns manually, right click anywhere in the section and select either Insert Row or Append Row, to add a row prior to the currently selected row or to add a row at the end, respectively. Then, type the column names to match from Table 1 to Table 2. To remove a field from the Join Map, simply right-click and select Delete.
Target Output Columns
Data Mapper Configuration
The Data Mapper is used to map columns from the source data to the target data table.
Inspection and Populating the Mapper
Using the Inspect Source menu button provides additional ways to map columns from source to target:
- Populate Both Mapping Tables: Propagates all values from the source data table into the target data table. This is done by default.
- Populate Source Mapping Table Only: Maps all values in the source data table only. This is helpful when modifying an existing workflow when source column structure has changed.
- Populate Target Mapping Table Only: Propagates all values into the target data table only.
If the source and target column options aren’t enough, other columns can be added into the target data table in several different ways:
- Propagate All will insert all source columns into the target data table, whether they already existed or not.
- Propagate Selected will insert selected source column(s) only.
- Right click on target side and select Insert Row to insert a row immediately above the currently selected row.
- Right click on target side and select Append Row to insert a row at the bottom (far right) of the target data table.
Deleting Columns
To delete columns from the target data table, select the desired column(s), then right click and select Delete.
Chaging Column Order
To rearrange columns in the target data table, select the desired column(s). You can use either:
- Bulk Move Arrows: Select the desired move option from the arrows in the upper right
- Context Menu: Right clikc and select Move to Top, Move Up, Move Down, or Move to Bottom.
Reduce Result to Distinct Records Only
To return only distinct options, select the Distinct menu option. This will toggle a set of checkboxes for each column in the source. Simply check any box next to the corresponding column to return only distinct results.
Depending on the situation, you may want to consider use of Summarization instead.
The distinct process retains the first unique record found and discards the rest. You may want to apply a sort on the data if it is important for consistency between runs.
Aggregation and Grouping
To aggregate results, select the Summarize menu option. This will toggle a set of select boxes for each column in the target data table. Choose an appropriate summarization method for each column.
- Group By
- Sum
- Min
- Max
- First
- Last
- Count
- Count (including nulls)
- Mean
- Standard Deviation
- Sample Standard Deviation
- Population Standard Deviation
- Variance
- Sample Variance
- Population Variance
- Advanced Non-Group_By
For advanced data mapper usage such as expressions, cleaning, and constants, please see the Advanced Data Mapper Usage
Output Filters
To allow for maximum flexibility, data filters are available on the source data and the target data. For larger data sets, it can be especially beneficial to filter out rows on the source so the remaining operations are performed on a smaller data set.
Select Subset Of Data
This filter type provides a way to filter the inbound source data based on the specified conditions.
Apply Secondary Filter To Result Data
This filter type provides a way to apply a filter to the post-transformed result data based on the specified conditions. The ability to apply a filter on the post-transformed result allows for exclusions based on results of complex calcuations, summarizaitons, or window functions.
Final Data Table Slicing (Limit)
The row slicing capability provides the ability to limit the rows in the result set based on a range and starting point.
Filter Syntax
The filter syntax utilizes Python SQLAlchemy which is the same syntax as other expressions.
View examples and expression functions in the Expressions area.
Examples
Join Automobile Manufacturers with Models
In this example, consider the following source data tables. First is a list of automobile manufacturers.
| Mfg_ID | Manufacturer |
|---|---|
| 1 | Aston Martin |
| 2 | Porsche |
| 3 | Lamborghini |
| 4 | Ferrari |
| 5 | Koenigsegg |
Next is a list of automobile models with a manufacturer ID. Note that there are several models with no manufacturer.
| ModelName | Mfg_ID |
|---|---|
| Aventador | 3 |
| Countach | 3 |
| DBS | 1 |
| Enzo | 4 |
| One-77 | 1 |
| Optimus Prime | |
| Batmobile | |
| Agera | 5 |
| Lightning McQueen |
To get a list of models by manufacturer, it makes sense to join on Mfg_ID. By leveraging outer join concepts, the output will also be able to show those items which do not have any matches.
First, specify parameters for Table 1 Data Selection. The source data table is selected and all columns are listed.
Next, specify parameters for Table 2 Data Selection. Once again, the source data table is selected and all columns are listed.
Finally, the join conditions are set in the Table Output tab. Using the Guess button, Analyze properly identifies the Mfg_ID column to use as the Join Key. Lastly, the
Target Output Columns are specified automatically using the Propagate button. This effectively includes all columns from all tables, with any join columns obviously only being included a single time. Note that the columns are sorted alphabetically, first by Manufacturer and next by ModelName.
As expected, the final output includes all rows from both tables, whether they had a match in both tables or not. As such, this time Porsche does indeed show up despite having no models. Additionally, Batmobile, Lightning McQueen, and Optimus Prime are included in the results even though none of them have a manufacturer. Besides, who can say ‘No’ to them?
4.4.15 - Table Pivot
Description
Used to convert long, narrow data tables into short, wide data tables. Selected columns are transposed, with the column names converted into values across multiple columns.
Perhaps the easiest example to understand is to think of a data table with months listed as rows:
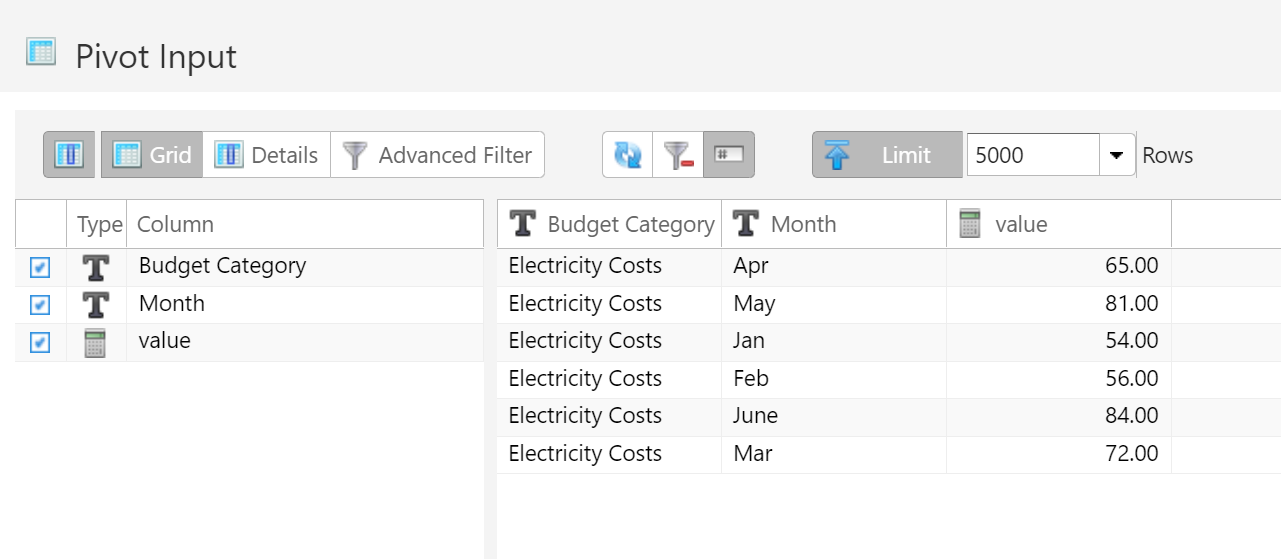
Pivoting this data table would convert all of the month rows into columns.
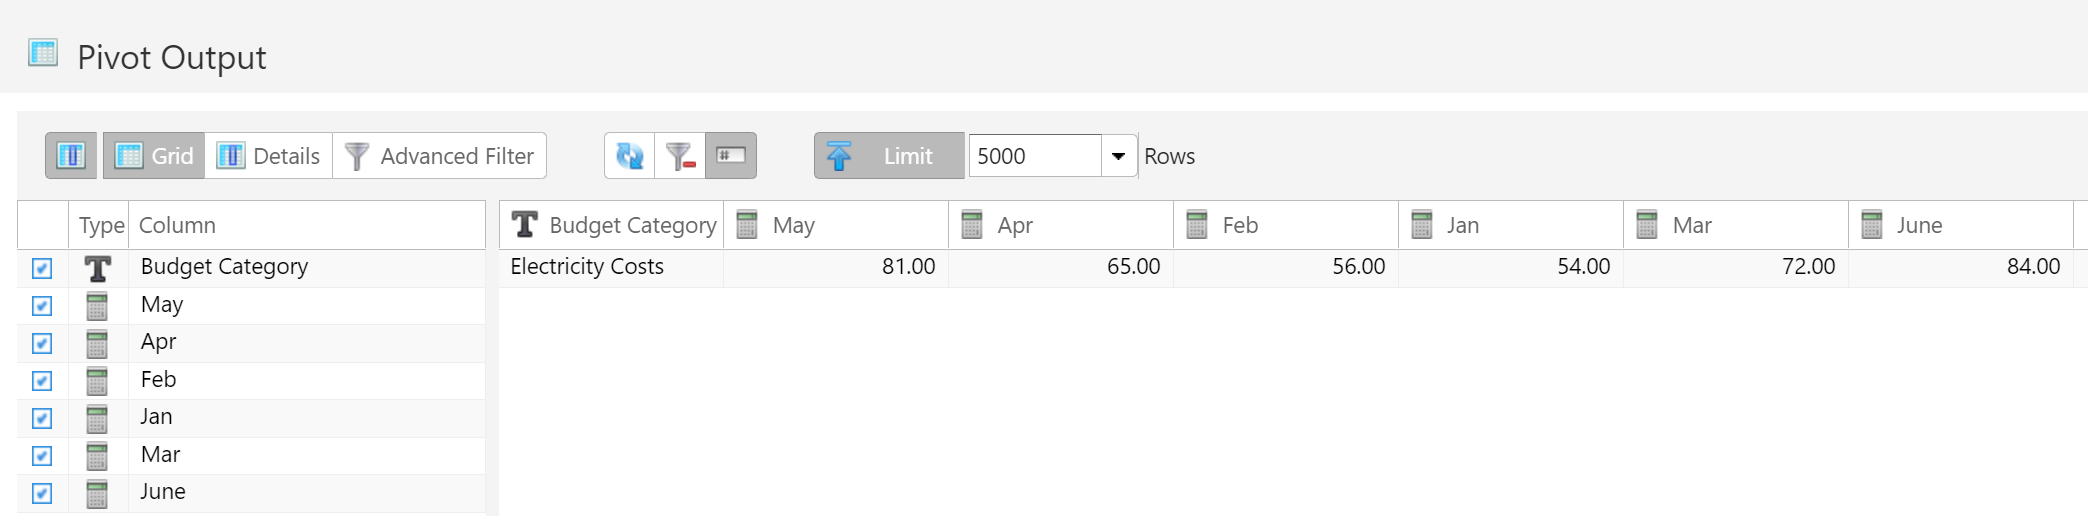
By specifying which columns to transpose and which columns to leave alone, this becomes a powerful tool. Making this conversion in other ETL tools could require a dozen more steps.
Source and Target Parameters
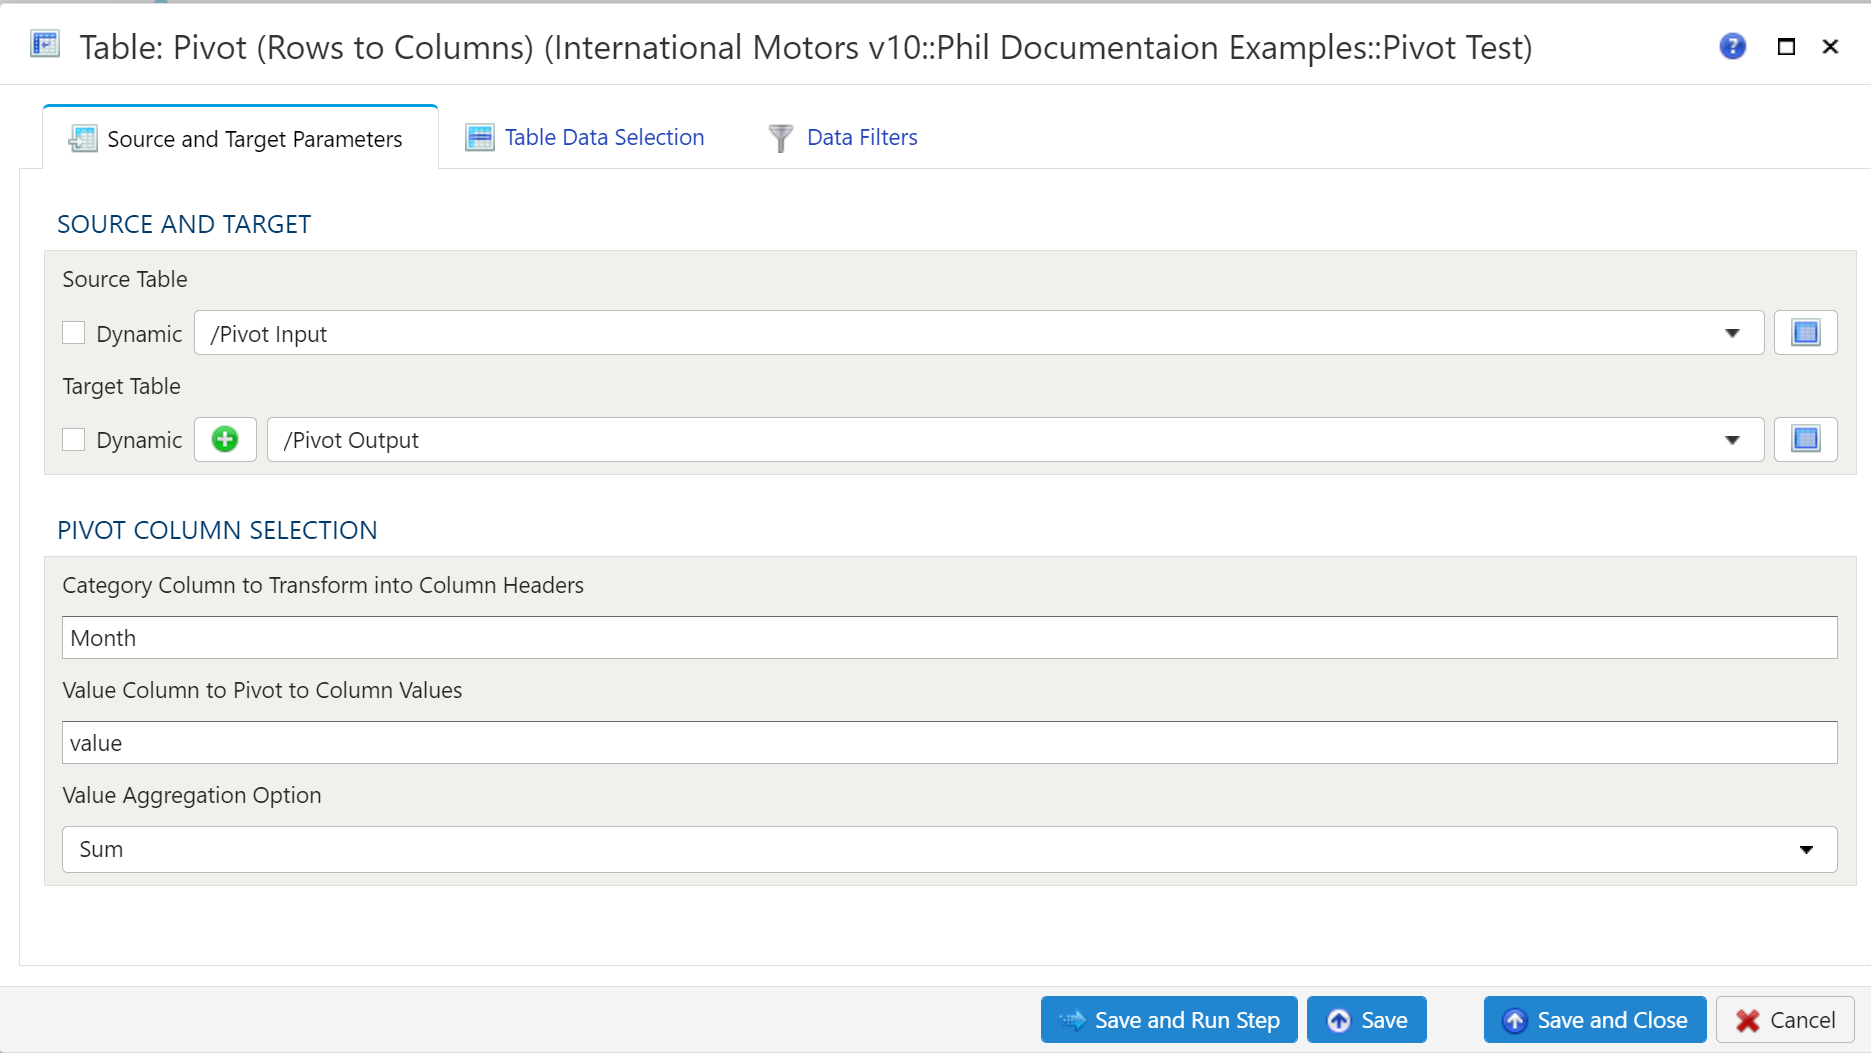
Source Table Selection
To establish the source and target, first select the data table to be extracted from using the dropdown menu.
Traget Table Selection
Target Table
To establish the target table select either an existing table as the target table using the Target Table dropdown or click on the green "+" sign to create a new table as the target.
Table Creation
When creating a new table you will have the option to either create it as a View or as a Table.
Views:
Views are useful in that the time required for a step to execute is significantly less than when a table is used. The downside of views is they are not a useful for data exploration in the table Details mode.
Tables:
When using a table as the target a step will take longer to execute but data exploration in the Details mode is much quicker than with a view.
Pivot Column Selection
The Category Column to Transform into Column Headers is where you specigy the column in Source Table that will be pivoted to rows. The Value Column ti Pivot to Column Vales is the column that containes the values in the Source Table. The Value Aggregation Option is where you specify how you want the data to aggregate.
Table Data Selection
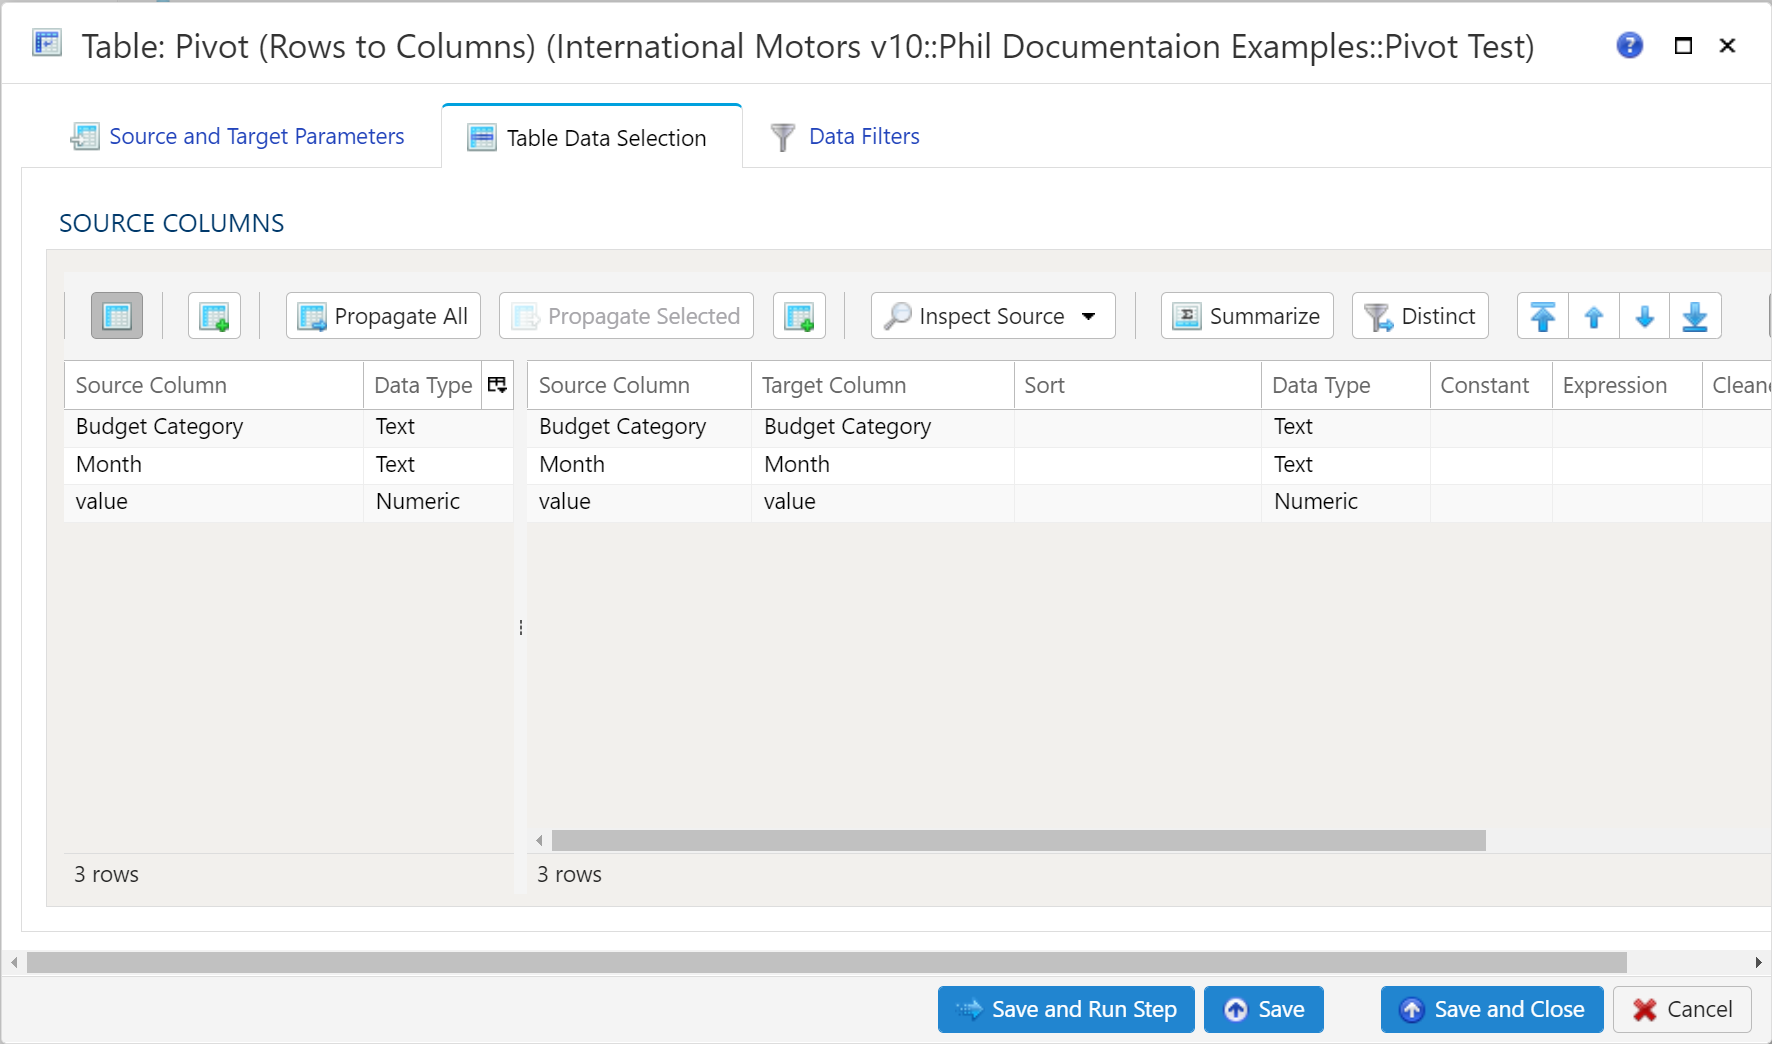
The Table Data Selection tab is used to map columns from the source data table to the target data table. All source columns on the left side of the window are automatically mapped to the target data table depicted on the right side of the window. Using the Inspect Source menu button, there are a few additional ways to map columns from source to target:
- Populate Both Mapping Tables: Propagates all values from the source data table into the target data table. This is by default.
- Populate Source Mapping Table Only: Maps all values in the source data table only. This is helpful when modifying an existing workflow when source column structure has changed.
- Populate Target Mapping Table Only: Propagates all values into the target data table only.
In addition to each of these options, each choice offers the ability to preview the source data.
If the source and target column options aren’t enough, other columns can be added into the target data table in several different ways:
- Propagate All will insert all source columns into the target data table, whether they already existed or not.
- Propagate Selected will insert selected source column(s) only.
- Right click on target side and select Insert Row to insert a row immediately above the currently selected row.
- Right click on target side and select Append Row to insert a row at the bottom (far right) of the target data table.
To delete columns from the target data table, select the desired column(s), then right click and select Delete.
To rearrange columns in the target data table, select the desired column(s), then right click and select Move to Top, Move Up, Move Down, or Move to Bottom.
To return only distinct options, select the Distinct menu option. This will toggle a set of checkboxes for each column in the source. Simply check any box next to the corresponding column to return distinct results only.
To aggregate results, select the Summarize menu option. This will toggle a set of drop down boxes for each column in the target data table. The following summarization options are available:
- Group by (set as default)
- Sum
- Min
- Max
- First
- Last
- Count
- Mean
- Median
- Mode
- Std Dev
- Variance
- Product
- Absolute Val
- Quantile
- Skew
- Kurtosis
- Mean Abs Dev
- Cumulative Sum
- Cumulative Min
- Cumulative Max
- Cumulative Product
For more aggregation details, see the Analyze overview page here.
Data Filters
To allow for maximum flexibility, data filters are available on the source data and the target data. For larger data sets, it can be especially beneficial to filter out rows on the source so the remaining operations are performed on a smaller data set.
Select Subset of Data
Any valid Python expression is acceptable to subset the data. Please see Expressions
for more details and examples.
Apply Secondary Filter To Result Data
Any valid Python expression is acceptable to subset the data. Please see Expressions for more details and examples
Final Data Table Slicing (Limit)
To limit the data, simply check the Apply Row Slicer box and then specify the following:
- Initial Rows to Skip: Rows of data to skip (column header row is not included in count)
- End at Row: Last row of data to include. This is different from simply counting rows at the end to drop
4.4.16 - Table Union All
Description
Use to combine multiple data tables with the same column structure into a single data table. For example, time series data is a prime candidate for this transform. The result is all of the records from the combined tables.
Sources
The Sources section serves as a collection of all data tables to append together. Typically, all of the data tables will have the same (or similar) column structure. There are two buttons available to add a data table to the list:
- Insert Row
- Append Row
Additionally, right-clicking in the Select Source to Edit window will display the same options. Right-clicking on a table already added will also display the Delete option.
To execute the transform properly, there will need to be one entry in the Sources section for every source data table to append together. These entries are listed in the order in which they will be appended. To adjust the order, right-clicking on a table will display the following options:
- Move Down (if applicable)
- Move To Bottom (if applicable)
- Move Up (if applicable)
- Move To Top (if applicable)
By default, each source is named New Table, but the modeler is encouraged to provide descriptive names by double-clicking the name and renaming accordingly.
Target Table
By default, the Target Table is left blank. Before naming, note that data tables must follow Linux naming conventions. As such, we recommend that names only consist of alphanumeric characters. Analyze will automatically scrub any invalid characters from the name. Additionally, it will limit the length to 256 characters, so be concise!
Target Table
To establish the target table select either an existing table as the target table using the Target Table dropdown or click on the green "+" sign to create a new table as the target.
Table Creation
When creating a new table you will have the option to either create it as a View or as a Table.
Views:
Views are useful in that the time required for a step to execute is significantly less than when a table is used. The downside of views is they are not a useful for data exploration in the table Details mode.
Tables:
When using a table as the target a step will take longer to execute but data exploration in the Details mode is much quicker than with a view.
Table Data Selection Tab
Source Table
Table Selection
There are two options for selecting the table or in the second option tables to:
The first option is to use the Specific Table dropdown to select the table.
The second is to use the Tables Matching Search option in which you specify the Search Path and Search Text to select the table or tables that match the search criteria. This option is very useful if you have a workflow that creates a series of commonly named tables that that have been saved appending the date.
Source Columns
Data Mapper Configuration
The Data Mapper is used to map columns from the source data to the target data table.
Inspection and Populating the Mapper
Using the Inspect Source menu button provides additional ways to map columns from source to target:
- Populate Both Mapping Tables: Propagates all values from the source data table into the target data table. This is done by default.
- Populate Source Mapping Table Only: Maps all values in the source data table only. This is helpful when modifying an existing workflow when source column structure has changed.
- Populate Target Mapping Table Only: Propagates all values into the target data table only.
If the source and target column options aren’t enough, other columns can be added into the target data table in several different ways:
- Propagate All will insert all source columns into the target data table, whether they already existed or not.
- Propagate Selected will insert selected source column(s) only.
- Right click on target side and select Insert Row to insert a row immediately above the currently selected row.
- Right click on target side and select Append Row to insert a row at the bottom (far right) of the target data table.
Deleting Columns
To delete columns from the target data table, select the desired column(s), then right click and select Delete.
Chaging Column Order
To rearrange columns in the target data table, select the desired column(s). You can use either:
- Bulk Move Arrows: Select the desired move option from the arrows in the upper right
- Context Menu: Right clikc and select Move to Top, Move Up, Move Down, or Move to Bottom.
Reduce Result to Distinct Records Only
To return only distinct options, select the Distinct menu option. This will toggle a set of checkboxes for each column in the source. Simply check any box next to the corresponding column to return only distinct results.
Depending on the situation, you may want to consider use of Summarization instead.
The distinct process retains the first unique record found and discards the rest. You may want to apply a sort on the data if it is important for consistency between runs.
Aggregation and Grouping
To aggregate results, select the Summarize menu option. This will toggle a set of select boxes for each column in the target data table. Choose an appropriate summarization method for each column.
- Group By
- Sum
- Min
- Max
- First
- Last
- Count
- Count (including nulls)
- Mean
- Standard Deviation
- Sample Standard Deviation
- Population Standard Deviation
- Variance
- Sample Variance
- Population Variance
- Advanced Non-Group_By
For advanced data mapper usage such as expressions, cleaning, and constants, please see the Advanced Data Mapper Usage
Data Filters
To allow for maximum flexibility, data filters are available on the source data and the target data. For larger data sets, it can be especially beneficial to filter out rows on the source so the remaining operations are performed on a smaller data set.
Select Subset Of Data
This filter type provides a way to filter the inbound source data based on the specified conditions.
Apply Secondary Filter To Result Data
This filter type provides a way to apply a filter to the post-transformed result data based on the specified conditions. The ability to apply a filter on the post-transformed result allows for exclusions based on results of complex calcuations, summarizaitons, or window functions.
Final Data Table Slicing (Limit)
The row slicing capability provides the ability to limit the rows in the result set based on a range and starting point.
Filter Syntax
The filter syntax utilizes Python SQLAlchemy which is the same syntax as other expressions.
View examples and expression functions in the Expressions area.
4.4.17 - Table Union Distinct
Description
Use to combine multiple data tables with the same column structure into a single data table. For example, time series data is a prime candidate for this transform. The result is always the distinct set of records after combining the data.
Sources
The Sources section serves as a collection of all data tables to append together. Typically, all of the data tables will have the same (or similar) column structure. There are two buttons available to add a data table to the list:
- Insert Row
- Append Row
Additionally, right-clicking in the Select Source to Edit window will display the same options. Right-clicking on a table already added will also display the Delete option.
To execute the transform properly, there will need to be one entry in the Sources section for every source data table to append together. These entries are listed in the order in which they will be appended. To adjust the order, right-clicking on a table will display the following options:
- Move Down (if applicable)
- Move To Bottom (if applicable)
- Move Up (if applicable)
- Move To Top (if applicable)
By default, each source is named New Table, but the modeler is encouraged to provide descriptive names by double-clicking the name and renaming accordingly.
Target Table
By default, the Target Table is left blank. Before naming, note that data tables must follow Linux naming conventions. As such, we recommend that names only consist of alphanumeric characters. Analyze will automatically scrub any invalid characters from the name. Additionally, it will limit the length to 256 characters, so be concise!
Target Table
To establish the target table select either an existing table as the target table using the Target Table dropdown or click on the green "+" sign to create a new table as the target.
Table Creation
When creating a new table you will have the option to either create it as a View or as a Table.
Views:
Views are useful in that the time required for a step to execute is significantly less than when a table is used. The downside of views is they are not a useful for data exploration in the table Details mode.
Tables:
When using a table as the target a step will take longer to execute but data exploration in the Details mode is much quicker than with a view.
Table Data Selection Tab
Source Table
Table Selection
There are two options for selecting the table or in the second option tables to:
The first option is to use the Specific Table dropdown to select the table.
The second is to use the Tables Matching Search option in which you specify the Search Path and Search Text to select the table or tables that match the search criteria. This option is very useful if you have a workflow that creates a series of commonly named tables that that have been saved appending the date.
Source Columns
Data Mapper Configuration
The Data Mapper is used to map columns from the source data to the target data table.
Inspection and Populating the Mapper
Using the Inspect Source menu button provides additional ways to map columns from source to target:
- Populate Both Mapping Tables: Propagates all values from the source data table into the target data table. This is done by default.
- Populate Source Mapping Table Only: Maps all values in the source data table only. This is helpful when modifying an existing workflow when source column structure has changed.
- Populate Target Mapping Table Only: Propagates all values into the target data table only.
If the source and target column options aren’t enough, other columns can be added into the target data table in several different ways:
- Propagate All will insert all source columns into the target data table, whether they already existed or not.
- Propagate Selected will insert selected source column(s) only.
- Right click on target side and select Insert Row to insert a row immediately above the currently selected row.
- Right click on target side and select Append Row to insert a row at the bottom (far right) of the target data table.
Deleting Columns
To delete columns from the target data table, select the desired column(s), then right click and select Delete.
Chaging Column Order
To rearrange columns in the target data table, select the desired column(s). You can use either:
- Bulk Move Arrows: Select the desired move option from the arrows in the upper right
- Context Menu: Right clikc and select Move to Top, Move Up, Move Down, or Move to Bottom.
Reduce Result to Distinct Records Only
To return only distinct options, select the Distinct menu option. This will toggle a set of checkboxes for each column in the source. Simply check any box next to the corresponding column to return only distinct results.
Depending on the situation, you may want to consider use of Summarization instead.
The distinct process retains the first unique record found and discards the rest. You may want to apply a sort on the data if it is important for consistency between runs.
Aggregation and Grouping
To aggregate results, select the Summarize menu option. This will toggle a set of select boxes for each column in the target data table. Choose an appropriate summarization method for each column.
- Group By
- Sum
- Min
- Max
- First
- Last
- Count
- Count (including nulls)
- Mean
- Standard Deviation
- Sample Standard Deviation
- Population Standard Deviation
- Variance
- Sample Variance
- Population Variance
- Advanced Non-Group_By
For advanced data mapper usage such as expressions, cleaning, and constants, please see the Advanced Data Mapper Usage
Data Filters
To allow for maximum flexibility, data filters are available on the source data and the target data. For larger data sets, it can be especially beneficial to filter out rows on the source so the remaining operations are performed on a smaller data set.
Select Subset Of Data
This filter type provides a way to filter the inbound source data based on the specified conditions.
Apply Secondary Filter To Result Data
This filter type provides a way to apply a filter to the post-transformed result data based on the specified conditions. The ability to apply a filter on the post-transformed result allows for exclusions based on results of complex calcuations, summarizaitons, or window functions.
Final Data Table Slicing (Limit)
The row slicing capability provides the ability to limit the rows in the result set based on a range and starting point.
Filter Syntax
The filter syntax utilizes Python SQLAlchemy which is the same syntax as other expressions.
View examples and expression functions in the Expressions area.
4.4.18 - Table Upsert
Description
Performs an update of existing records and append new ones.
Upsert Parameters
To establish the source and target tables, first select the data table to be extracted from using the Source Table dropdown menu. Next, select an existing table as the target table using the Target Table dropdown.
Source Table Data Selection
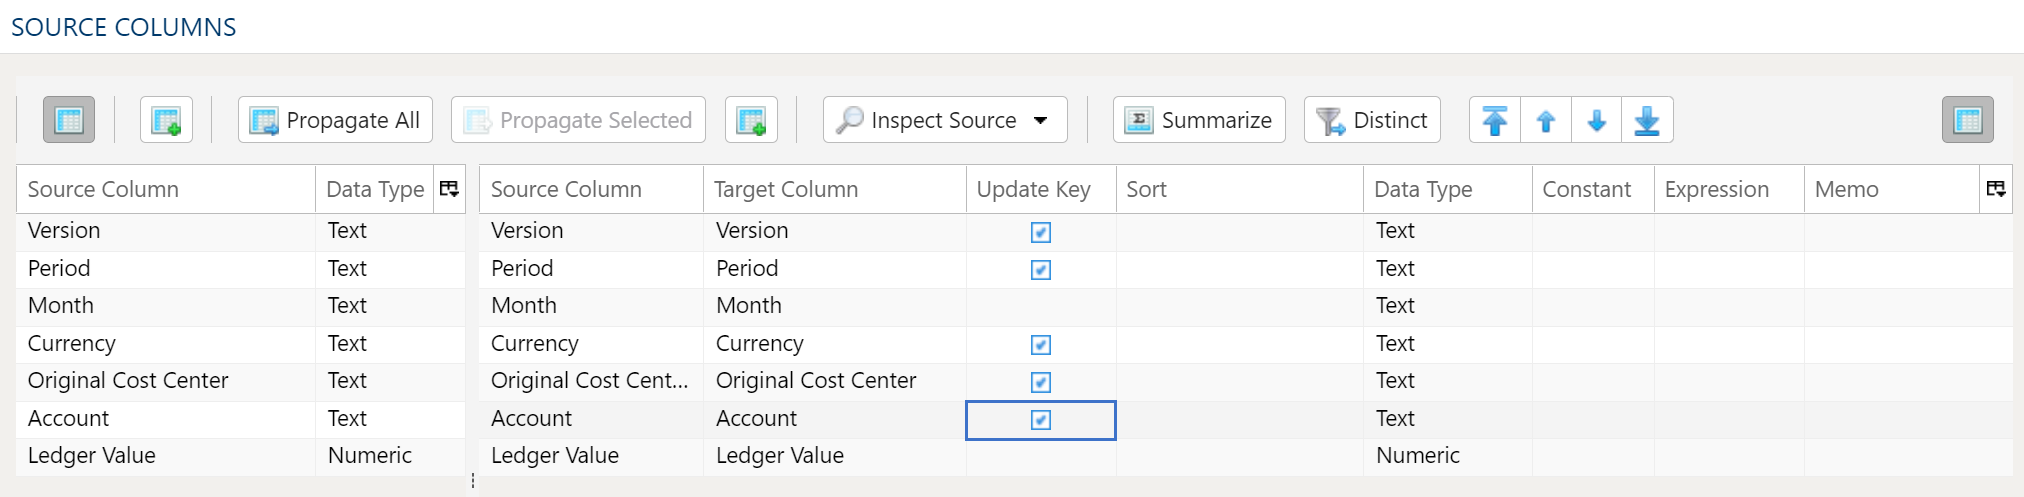
The Data Mapper is used to map columns from the source data to the target data table.
Inspection and Populating the Mapper
Using the Inspect Source menu button provides additional ways to map columns from source to target:
- Populate Both Mapping Tables: Propagates all values from the source data table into the target data table. This is done by default.
- Populate Source Mapping Table Only: Maps all values in the source data table only. This is helpful when modifying an existing workflow when source column structure has changed.
- Populate Target Mapping Table Only: Propagates all values into the target data table only.
If the source and target column options aren’t enough, other columns can be added into the target data table in several different ways:
- Propagate All will insert all source columns into the target data table, whether they already existed or not.
- Propagate Selected will insert selected source column(s) only.
- Right click on target side and select Insert Row to insert a row immediately above the currently selected row.
- Right click on target side and select Append Row to insert a row at the bottom (far right) of the target data table.
Deleting Columns
To delete columns from the target data table, select the desired column(s), then right click and select Delete.
Chaging Column Order
To rearrange columns in the target data table, select the desired column(s). You can use either:
- Bulk Move Arrows: Select the desired move option from the arrows in the upper right
- Context Menu: Right clikc and select Move to Top, Move Up, Move Down, or Move to Bottom.
Reduce Result to Distinct Records Only
To return only distinct options, select the Distinct menu option. This will toggle a set of checkboxes for each column in the source. Simply check any box next to the corresponding column to return only distinct results.
Depending on the situation, you may want to consider use of Summarization instead.
The distinct process retains the first unique record found and discards the rest. You may want to apply a sort on the data if it is important for consistency between runs.
Update Key
In order for the Upsert to update the existing and append new records you need to select the columns in the data that create a unique key.
Source Data Filters
To allow for maximum flexibility, data filters are available on the source data and the target data. For larger data sets, it can be especially beneficial to filter out rows on the source so the remaining operations are performed on a smaller data set.
Select Subset Of Data
This filter type provides a way to filter the inbound source data based on the specified conditions.
Apply Secondary Filter To Result Data
This filter type provides a way to apply a filter to the post-transformed result data based on the specified conditions. The ability to apply a filter on the post-transformed result allows for exclusions based on results of complex calcuations, summarizaitons, or window functions.
Final Data Table Slicing (Limit)
The row slicing capability provides the ability to limit the rows in the result set based on a range and starting point.
Filter Syntax
The filter syntax utilizes Python SQLAlchemy which is the same syntax as other expressions.
View examples and expression functions in the Expressions area.
4.5 - Dimension Steps
4.5.1 - Dimension Clear
Description
Clears the contents of a dimension including structure, values, aliases, properties, and alternate hierarchies
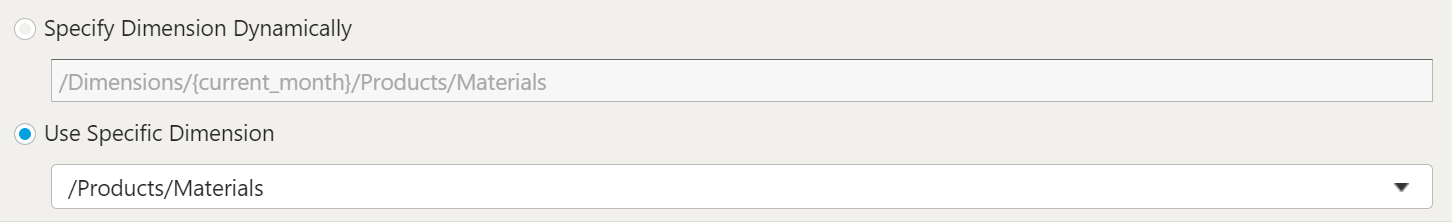
Dimension Selection
Specify Dimension Dynamically
If dimensions or paths were created dynamically then same variables can be used to clear them. Using variables in the clear process is useful since it eliminates the need to update the Dimension Clear step manually on a periodic basis.
An example that uses the current_month variable to dynamically clear the Materials dimension:
/Dimensions/{current_month}/Products/Materials
Use Specific Dimension
Use the dropdown menu to select a specific dimension to clear.
4.5.2 - Dimension Create
Description
Creates a dimension for use and loading
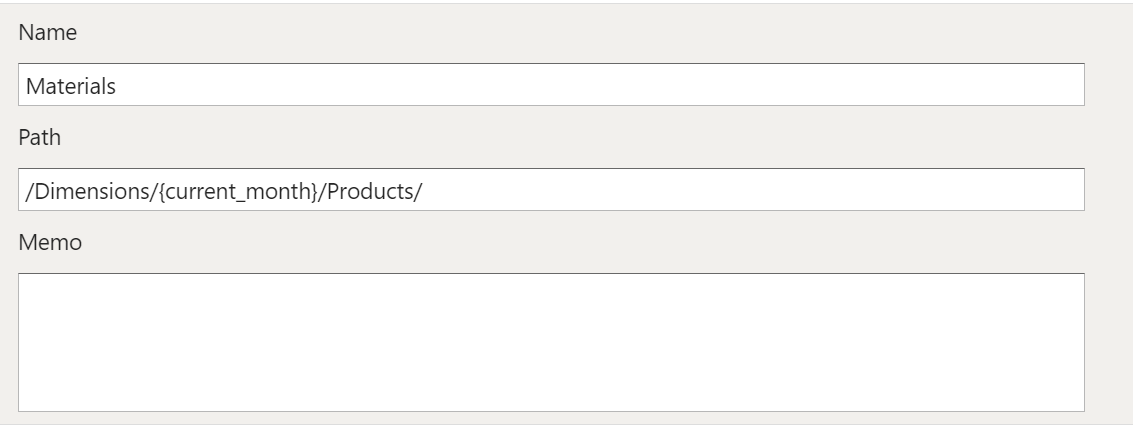
Dimension To Create
Name
You can either use a specific name for the dimension to be created or include variables for dynamic naming.
Variables are useful when dimensions are updated on a periodic basis and retaining the historical view is desired.
An example that uses the current_month variable to dynamically name the dimension:
dimension_name_{current_month}
Path
Paths let you create folder structures that the dimensions are are stored in. You can use variables here as well to make the folder structure dynamic.
An example that uses the current_month variable to dynamically name a folder:
/Dimensions/{current_month}/Product/
Memo
The Memo field is used a place to store comments or notes.
4.5.3 - Dimension Delete
Description
Deletes a dimension along with all associated structure, values, properties, aliases, and alternate hierarchies
Dimension Selection
Specify Dimension Dynamically
If dimensions or paths were created dynamically then same variables can be used to delete them. Using variables in the delete process is useful since it eliminates the need to update the Dimension Delete step manually on a periodic basis.
An example that uses the current_month variable to dynamically delete the Materials dimension:
/Dimensions/{current_month}/Products/Materials
Use Specific Dimension
Use the dropdown menu to select a specific dimension to delete.
4.5.4 - Dimension Load
Description
Load and update dimensions using data from PlaidCloud tables.
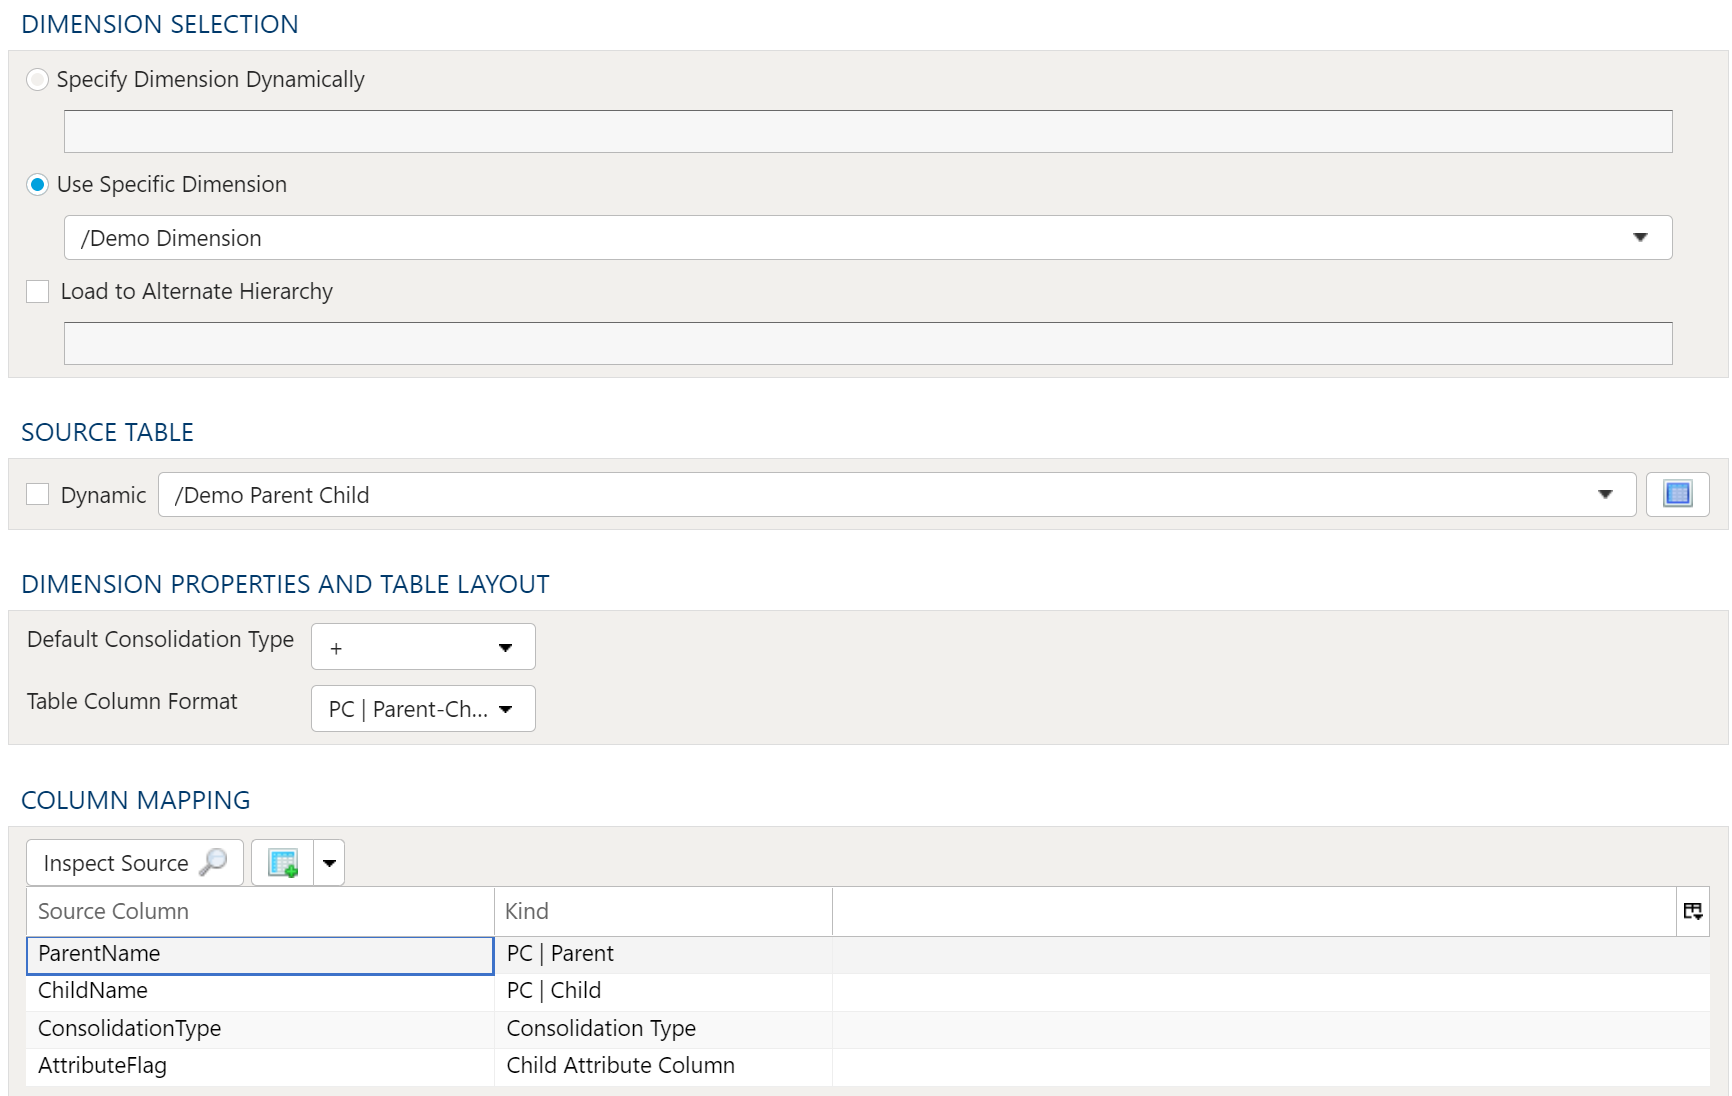
Dimension Selection
Specify Dimension Dynamically
To specify a dimension dynamically you include project and or local variables in the name.
Variables are useful when dimensions are updated on a periodic basis and retaining the historical view is desired.
An example that uses the current_month variable to dynamically load the dimension:
dimension_name_{current_month}
Use Specific Dimension
To use a specific dimension select the dimension using the drop down menu.
Load to Alternate Hierarchy
To load an Alternate Hierarchy fist select the dimension either dynamically or specifically, click the Load to Alternate Hierarchy checkbox and enter the name of the alternate hierarchy to be loaded.
Source Table
Dynamic
To specify the source table dynamically click the Dynamic Checkbox and enter the table name including the project and or local variables in the name.
Static
To use a specific source table select the table using the drop down menu.
Dimension Properties And Table Layout
Default Consolidation Type
There are three options for consolidation types:
- "+": Aggregates values in the dimension.
- "-": Subtracts values in the dimension.
- "~": No aggregation is performed in the dimension.
Table Column Format
There are two options for fomatting the Source Table when loading a dimension.
Parent Child
In a Parent Child table there are two columns that represent the dimensions structure, Parent and Child.
EXAMPLE PARENT CHILD
| PARENT | CHILD | Consolidation Type |
|---|---|---|
| Parent All | Parent 1 | ~ |
| Parnet All | Parent 2 | ~ |
| Parent 1 | Child 1 | + |
| Parent 2 | Child 2 | + |
| Child 1 | Child 3 | + |
| Child 1 | Child 4 | + |
| Child 2 | Child 5 | + |
Flattened Levels
In a Flattend Level table there are an infinte number of columns with each column representing a level of the dimension.
EXAMPLE FLATTENED LEVELS
| Level 1 | Level 2 | Level 3 | Level 4 |
|---|---|---|---|
| Parent All | Parent 1 | Child 1 | Child 3 |
| Parent All | Parent 1 | Child 1 | Child 4 |
| Parent All | Parent 2 | Child 2 | Child 5 |
Column Mapping
Using the Inspect Source menu button populates the Source Column in the data mapper. Once the Source Column has been populated use the Kind drop down menu to map the Source Columns to the appropriate column type.
4.5.5 - Dimension Sort
Description
Sort dimensions automatically.
Dimension Selection
Specify Dimension Dynamically
If dimensions or paths were created dynamically then same variables can be used to sort them. Using variables in the sort process is useful since it eliminates the need to update the Dimension Sort step manually on a periodic basis.
An example that uses the current_month variable to dynamically sort the Materials dimension:
/Dimensions/{current_month}/Products/Materials
Use Specific Dimension
Use the dropdown menu to select a specific dimension to sort.
4.6 - Document Steps
4.6.1 - Compress PDF
Documentation coming soon...
4.6.2 - Concatenate Files
Documentation coming soon...
4.6.3 - Convert Document Encoding
Description
Concatenates files to form a single file.
Examples
Create a source input, select the input file and browse for the file within that location. Select the desired output location, and browse to selected the desired location for the file. Save and run.
4.6.4 - Convert Document Encoding to ASCII
Description
Updates file encoding and converts all characters to ASCII. This is particularly useful if the source of information has mixed encodings or other tools don’t support certain encodings.
Examples
Select the input file and browse for the file within that location. Select the desired output location, and browse to select the desired location for the file. Save and run.
4.6.5 - Convert Document Encoding to UTF-8
Description
Updates file encoding and converts all characters to UTF-8. This is particularly useful if the information source has mixed encodings or other tools don’t support certain encodings.
Examples
Select the input file and browse for the file within that location. Select the desired output location, and browse then select the desired location for the file. Save and run.
4.6.6 - Convert Document Encoding to UTF-16
Description
Updates file encoding and converts all characters to UTF-16. This is particularly useful if the information source has mixed encodings or other tools don’t support certain encodings.
Examples
Select the input file and browse for the file within that location. Select the desired output location, and browse then select the desired location for the file. Save and run.
4.6.7 - Convert Image to PDF
Documentation coming soon...
4.6.8 - Convert PDF or Image to JPEG
Documentation coming soon...
4.6.9 - Copy Document Directory
Description
Copy an entire directory within PlaidCloud Document.
Copy Directory
First, select the appropriate account from the dropdown menu.
Next, press the Browse button to select the directory you’d like to copy.
Select Destination
First, select the appropriate account from the dropdown menu.
Next, press the Browse button to select the destination for the copied directory.
If desired, the copied directory can be given a new name. To do so, simply check the Rename the Copied Folder to: box and type in a new name.
Examples
No examples yet...
4.6.10 - Copy Document File
Description
Copy a single file within PlaidCloud Document.
File To Copy
First, select the appropriate account from the dropdown menu.
Next, press the Browse button to select the file you’d like to copy.
Select Destination
First, select the appropriate account from the dropdown menu.
Next, press the Browse button to select the destination for the copied file.
By default, Analyze will not allow files to be overwritten. Instead, a numerical suffix will be added to each subsequent copy.
To overwrite the existing file, simply check the Allow Overwriting Existing File box.
To rename the file, check the Rename the copied file to box and type in a new name.
Examples
No examples yet...
4.6.11 - Create Document Directory
Description
Create a new directory within PlaidCloud Document.
Where to Create New Folder
First, select the appropriate account from the dropdown menu.
Next, press the Browse button to select the parent directory.
New Folder Name
Type the name for the new directory.
Examples
No examples yet...
4.6.12 - Crop Image to Headshot
Documentation coming soon...
4.6.13 - Delete Document Directory
Description
Delete an existing directory from within PlaidCloud Document.
Folder to Delete
First, select the appropriate account from the dropdown menu.
Next, press the Browse button to select the directory to delete.
Examples
No examples yet...
4.6.14 - Delete Document File
Description
Delete an existing file from within PlaidCloud Document.
File to Delete
First, select the appropriate account from the dropdown menu.
Next, press the Browse button to select the file to delete.
Examples
No examples yet...
4.6.15 - Document Text Substitution
Description
Performs text substitution in the specified file.
Examples
No examples yet...
4.6.16 - Fix File Extension
Documentation coming soon...
4.6.17 - Merge Multiple PDFs
Documentation coming soon...
4.6.18 - Rename Document Directory
Description
Rename an existing directory within PlaidCloud Document.
Folder to Rename
First, select the appropriate account from the dropdown menu.
Next, press the Browse button to select the directory to be renamed.
Rename To
Type the new name for the directory.
Examples
No examples yet...
4.6.19 - Rename Document File
Description
Rename an existing file within PlaidCloud Document.
File to Rename
First, select the appropriate account from the dropdown menu.
Next, press the Browse button to select the file to be renamed.
Rename To
Type the new name for the file.
Examples
No examples yet...
4.7 - Notification Steps
4.7.1 - Notify Distribution Group
Description
Send an email notification to a PlaidCloud distribution group. Messages are sent from info@tartansolutions.com. No outbound setup is required.
Select PlaidCloud Distribution List
Select a single distribution list from the drop down menu. Distribution lists can be created using Tools. For details on creating a distribution list, see here: PlaidCloud Tools – Distro.
Message
Specify Subject and Body as desired.
Please note that both Project Variables and Workflow Variables are available for use with this transform, in both the subject line and the message body.
Additionally, standard HTML code is permitted in the body to further customize the look of the email messages.
Examples
In this example, all of the system variables are used. Additionally, there is a small bit of HTML used to format the first line of the body. Executing this transform will send the following email to all members specified in the distribution group:
- FROM: info@tartansolutions.com (remember that all messages come from this address)
- Subject: DEMO Analyze Demo Running
4.7.2 - Notify Agent
Description
Notify a PlaidCloud Agent.
Examples
No examples yet...
4.7.3 - Notify Via Email
Description
Send email notifications. Messages are sent from info@tartansolutions.com email account. No outbound setup is required.
Email Addresses
Specify any number of email recipients. Acceptable delimiters include semicolon (;) and comma (,).
Message
Specify Subject and Body as desired.
Please note that both Project Variables and Workflow Variables are available for use with this transform, in both the subject line and the message body.
Additionally, standard HTML code is permitted in the body to further customize the look of the email messages.
Attachments
Attaching files to emails is very simple. Select a file or folder from Document to attach. If a folder is selected, the contents of the folder will be attached as individual files. Variable substitution works with paths for better control of file attachments when sending out personalized emails.
Examples
In this example, all of the system variables are used. Additionally, there is a small bit of HTML used to format the first line of the body. Executing this transform will send the following email:
- TO: info@tartansolutions.com
- FROM: info@tartansolutions.com (remember that all messages come from this address)
- Subject: DEMO – Workflow Analyze Demo Running
4.7.4 - Notify Via Log
Description
Write a message to the Analyze workflow log.
Message Parameters
Type the desired message to write to the log. Then select one of three severity levels from the following:
- Information
- Warning
- Error
Please note that both Project Variables and Workflow Variables are available for use with this transform.
Examples
In this example, executing this transform will append an Information item to the log, stating Write a message to the workflow log. I believe you have my stapler, Demo.
4.7.5 - Notify via Microsoft Teams
Adding Microsoft Teams notifications from a workflow is a two part process. The two parts are:
- Create a Microsoft Teams external connection
- Add Microsoft Teams notification steps to your workflows
Add Microsoft Teams Notification Step to Workflow
Adding Microsoft Teams notification steps to the workflow is the same as adding other steps to a workflow. Upon adding the step, open the step configuration, complete the form, and save it. You can now test your Microsoft Teams notification.
Formatting the Microsoft Teams Message
Teams has many formatting options including adding images and mentioning users. Please reference the Teams Message Text Formatting documentation for details.
Create Microsoft Teams External Connection
This is a one-time setup to allow PlaidCloud to send Microsoft Teams notifications on your behalf. Microsoft Teams allows creation of a Webhook App (a generic way to send a notification over the internet). After creating the Webhook App in Microsoft Teams, add the supplied credentials to PlaidCloud to allow its use.
Microsoft Teams Webhook App Creation
These steps will need to be performed by a Microsoft Teams administrator. Follow the steps outlined here for Creating Incoming Webhook (Microsoft Teams Documentation).
PlaidCloud External Connection Setup
These steps will need to be performed by a PlaidCloud workspace administrator with permissions to create External Data Connections. Follow these steps to create the connection:
- Navigate to
Analyze > Tools > External Data Connections - Under the
+ New Connectionselection, pick Microsoft Teams Webhook - Complete the name, description, and paste in the webhook url generated during the webhook creation above. The name provided here will be shown as the selection in the workflow step so it should be descriptive if possible.
- Select the
+ Createbutton
Examples
No examples yet...
4.7.6 - Notify via Slack
Adding Slack notifications from a workflow is a two part process. The two parts are:
- Create a Slack Webhook external connection
- Add Slack notification steps to your workflows
Add Slack Notification Step to Workflow
Adding Slack notification steps to the workflow is the same as adding other steps to a workflow. Upon adding the step, open the step configuration, complete the form, and save it. You can now test your Slack notification.
Formatting the Slack Message
Slack has many formatting options including adding images and mentioning users. Please reference the Slack Text Formatting documentation for details.
Create Slack Webhook External Connection
This is a one-time setup to allow PlaidCloud to send Slack notifications on your behalf. Slack allows creation of a Webhook App (a generic way to send a notification over the internet). After creating the Webhook App in Slack, add the supplied credentials to PlaidCloud to allow its use.
Slack Webhook App Creation
These steps will need to be performed by a Slack administrator. Follow these steps to create a Slack Webhook App:
- From Slack, open the workspace control menu and select
Settings & administration > Manage Apps - Select
Custom Integrationsfrom the Apps category list - Select
Incoming Webhooksfrom the list of apps - Select the
Add to Slackbutton - On the next screen, select the Slack Channel you wish to post the messages and continue. This is the default channel that will be used but it can be overridden in each notification including sending DMs to specific individuals.
- Copy the webhook URL displayed. This will be used later so keep it in a safe place. It will look something like this:
https://hooks.slack.com/services/T04QZ1435/G02TGBFTOP8/K9GZrR2ThdJz1uSiL9YeZxoR - You can customize the appearance, name, and emoji before saving. These customizations are only the defaults and these can be overridden on each notification step within a PlaidCloud workflow.
PlaidCloud External Connection Setup
These steps will need to be performed by a PlaidCloud workspace administrator with permissions to create External Data Connections. Follow these steps to create the connection:
- Navigate to
Analyze > Tools > External Data Connections - Under the
+ New Connectionselection, pick Slack Webhook - Complete the name, description, and paste in the webhook url provided in step 6 above. The name provided here will be shown as the selection in the workflow step so it should be descriptive if possible.
- Select the
+ Createbutton
Examples
No examples yet...
4.7.7 - Notify Via SMS
Description
Send an SMS message. Messages are sent from info@tartansolutions.com email account. No outbound setup or data is required.
Carrier and Number
From the Mobile Provider dropdown list, select from hundreds of domestic and international providers. For the convenience of the majority of our customers, USA carriers are listed first, followed by all international options listed alphabetically.
Next, specify a valid phone number. Acceptable formats include the following:
- 5555555555
- 555.555-5555
- 555.555.5555
- 555-555-5555
Message
Specify Subject and Message as desired.
Please note that both Project Variables and Workflow Variables are available for use with this transform, in both the subject line as well as the message body.WARNING: Standard data rates may apply for recipients.
Examples
No examples yet...
4.7.8 - Notify Via Twitter
Description
Send a Twitter Direct Message (DM) from @plaidcloud.
Twitter Account
Specify the twitter account to receive the DM from @plaidcloud. This user must be following @plaidcloud to receive the message. It is allowable, although not required, to prefix the username with the at sign (@).
Message
Enter the desired message. Analyze will not permit a value longer than 140 characters.
Please note that both Project Variables and Workflow Variables are available for use with this transform.
Examples
In this example, a DM is sent from @PlaidCloud to @tartansolutions. System variables are used in the message. The final message reads, Analyze Demo is running on #PlaidCloud.
4.7.9 - Notify Via Web Hook
Description
Send a notification via Web Hook (URL).
Examples
No examples yet...
4.8 - Agent Steps
4.8.1 - Agent Remote Execution of SQL
Description
Execute specified SQL on a remote database through a PlaidLink Agent connection.
4.8.2 - Agent Remote Export of SQL Result
Description
Execute specified SQL on a remote database through a PlaidLink Agent connection and export the result for use by PlaidCloud or other downstream systems.
Examples
No examples yet...
4.8.3 - Agent Remote Import Table into SQL Database
Description
Imports specified data into SQL database on a remote system through a PlaidLink Agent connection.
Examples
No examples yet...
4.8.4 - Document - Remote Delete File
Description
Deletes a remote file system file using a PlaidLink agent installed within the firewall.
Examples
First, make a selection from the “Agent to Use” dropdown. Next, enter the file or folder path under “File or Folder Path for Delete”. Finally, select “Save and Run Step”.
4.8.5 - Document - Remote Export File
Description
Exports a file to a remote file system using a PlaidLink agent installed within the firewall.
Examples
First, make a selection from the “Agent to Use” dropdown. Next, browse for the file or folder path under “File or Folder to Export”. Then enter the location under “Export Path Destination”. Finally, select “Save and Run Step”.
4.8.6 - Document - Remote Import File
Description
Imports a remote file system file using a PlaidLink agent installed within the firewall.
Examples
First, make a selection from the “Agent to Use” dropdown. Next, enter the file or folder path under “File or Folder Path for Import”. Then enter the folder destination under “Folder Destination”. Select the file type from the dropdown. Finally, select “Save and Run Step”.
4.8.7 - Document - Remote Rename File
Description
Renames or moves a remote file system file using a PlaidLink agent installed within the firewall.
Examples
First, make a selection from the “Agent to Use” dropdown.
Next, enter “Source Path” and “Destination Path”.
Finally, select “Save and Run Step”.
4.9 - General Steps
4.9.1 - Pass
Description
The Pass Through transform does not do anything. Its purpose as a placeholder is useful during development or when in need of a separator to section off steps during complex workflows.
4.9.2 - Run Remote Python
Description
This transform will run a Python file using PlaidLink. The Python file is executed on the remote system.
A set of global variables can be passed from the script execution on the remote system.
Examples
No examples yet...
4.9.3 - User Defined Transform
Description
The Standard Workflow Transforms that come with PlaidCloud can typically perform nearly every operation you’ll need. Additionally, these Standard Transforms are continuously optimized for performance, and they provide the most robust data. However, when the standard options, used singularly or in groups, are not able to achieve your goals, you can create User Defined Transforms to meet your needs. Standard Python code is permitted.
Coding with Python is required to create a User Defined Transform. For additional information, please visit the Python website.
User Defined Transforms
To create a new User Defined Function (UDF), open the workflow which needs the custom transform, select the User Defined tab, and click the Add User Defined Function button. Specify an ID for the UDF. Once created, select the Edit function logic icon (far left) to open the “Edit User Defined Function” window.
Alternatively, a previously created User Defined function can be imported using the Import button from within the User Defined tab. Simply press that button and then select the appropriate workflow from the dropdown menu (this menu contains all workflows within the current workspace). Next, select the function(s) to be imported and press the Import Selected Functions button.
Once the function has been created/imported, proceed to the Analyze Steps tab of the workflow and add a User Defined Transform step in the appropriate position, just as you would add a Standard Transform. In the config window, select the appropriate User Defined Function from the dropdown menu.
4.9.4 - Wait
Description
The Wait transform is used to pause processing for a specified duration. This can be especially helpful when waiting for I/O operations from other systems or for debugging workflows during development.
Duration Parameters
Specify a non-negative integer value using the Duration spinner.
Next, specify the unit of time from the dropdown menu. The following units are available for selection:
- Seconds
- Minutes
- Hours
4.10 - PDF Reporting Steps
4.10.1 - Report Single
Description
Generates a PDF report based on the defined RML template and input data sources for the report.
Examples
No examples yet...
4.10.2 - Reports Batch
Description
Generates many PDF reports based on the defined RML template and input data sources for each report.
Examples
No examples yet...
4.11 - Common Step Operations
4.11.1 - Advanced Data Mapper Usage
Review
Before jumping into the advanced usage capabilities of the Data Mapper, a brief review of the basic functionality will help.
Data Mapper Configuration
The Data Mapper is used to map columns from the source data to the target data table.
Inspection and Populating the Mapper
Using the Inspect Source menu button provides additional ways to map columns from source to target:
- Populate Both Mapping Tables: Propagates all values from the source data table into the target data table. This is done by default.
- Populate Source Mapping Table Only: Maps all values in the source data table only. This is helpful when modifying an existing workflow when source column structure has changed.
- Populate Target Mapping Table Only: Propagates all values into the target data table only.
If the source and target column options aren’t enough, other columns can be added into the target data table in several different ways:
- Propagate All will insert all source columns into the target data table, whether they already existed or not.
- Propagate Selected will insert selected source column(s) only.
- Right click on target side and select Insert Row to insert a row immediately above the currently selected row.
- Right click on target side and select Append Row to insert a row at the bottom (far right) of the target data table.
Deleting Columns
To delete columns from the target data table, select the desired column(s), then right click and select Delete.
Chaging Column Order
To rearrange columns in the target data table, select the desired column(s). You can use either:
- Bulk Move Arrows: Select the desired move option from the arrows in the upper right
- Context Menu: Right clikc and select Move to Top, Move Up, Move Down, or Move to Bottom.
Reduce Result to Distinct Records Only
To return only distinct options, select the Distinct menu option. This will toggle a set of checkboxes for each column in the source. Simply check any box next to the corresponding column to return only distinct results.
Aggregation and Grouping
To aggregate results, select the Summarize menu option. This will toggle a set of select boxes for each column in the target data table. Choose an appropriate summarization method for each column.
Advanced Usage
Aggregation Options
To aggregate results, select the Summarize menu option. This will toggle a set of select boxes for each column in the target data table. The following summarization options are available:
| Function | Description |
|---|---|
| Group By | Groups results by the value |
| Count | Number of non-null observations in group |
| Count (including nulls) | Number of observations in group |
| Sum | Sum of values in group |
| Mean | Mean of values in group |
| Median | Median of values in group |
| Mode | Mode of values in group |
| Min | Minimum of values in group |
| Max | Maximum of values in group |
| First | First value of values in group using the sorted order |
| Last | Last value of values in group using the sorted order |
| Standard Deviation | Unbiased standard deviation in group |
| Sample Standard Deviation | Sample standard deviation in group |
| Population Standard Deviation | Population standard deviation in group |
| Variance | Unbiased variance in group |
| Sample Variance | Sample Variance in group |
| Population Variance | Population Variance in group |
| Advanced Non-Group-By | Special aggregation selection when using window functions |
Pick the appropriate summarization method for the column.
When using a Window Function, select Advanced Non-Group-By as the aggregation method. This special selection is required due to the aggregation inherent in the window function already.
Constants
Specifying a value in the Constant column will override the source column value, if specified, and populate the column with the constant value specified.
Cleaners
The Data Mapper provides a convenient point-and-click cleaner capability to apply conversions to the data within a column.
The cleaning operations include the following categories:
- Text Trimming
- Text Formatting
- Text Transformations
- Converting to and from NULL values
- Number Formatting
- Date Parsing
The result of the cleaner selections are converted into a consolidated expression which is viewable in the Expression information.
Expressions
Expressions in the Data Mapper are one of the most powerful and flexible concepts in PlaidCloud. They provide nearly unlimited flexibility while being exceptionally performant, even on extremely large data.
Expressions are written using Python SQLAlchemy syntax along with a few additional helper functions available in PlaidCloud. This allows PlaidCloud to expose the full set of capabilities of the underlying data warehouse (e.g. Greenplum, SAP HANA, Redshift, etc...) directly. In addition, there are many resources available publicly that provide quick references for use of SQLAlchemy operations. By using standard SQLAlchemy syntax, PlaidCloud avoids the common pitfall of creating yet another domain specific syntax.
The expression editor is opened by double-clicking on the expression cell for the column. Once open, the list of columns are shown on the left while an extensive library of functions are shown on the right.
While it is entirely possible to type the expression directly into the editor, it is normally easier to use the point-and-click function and column selection to get started. The library of functions include the following groups:
- Conditions
- Column Specific Conditions
- Conversions
- Dates
- Math
- Text
- Summarizations
- Window Function Operations
- Arrays
- JSON
- PostGIS (Geospatial)
- Trigonmetry
Once you have completed the expression, save the expression so it will be applied to the column.
View examples and expression functions in the Expressions area.
4.12 - Allocation By Assignment Dimension
Description
Allocate values based on an assignment dimesion and driver data table.
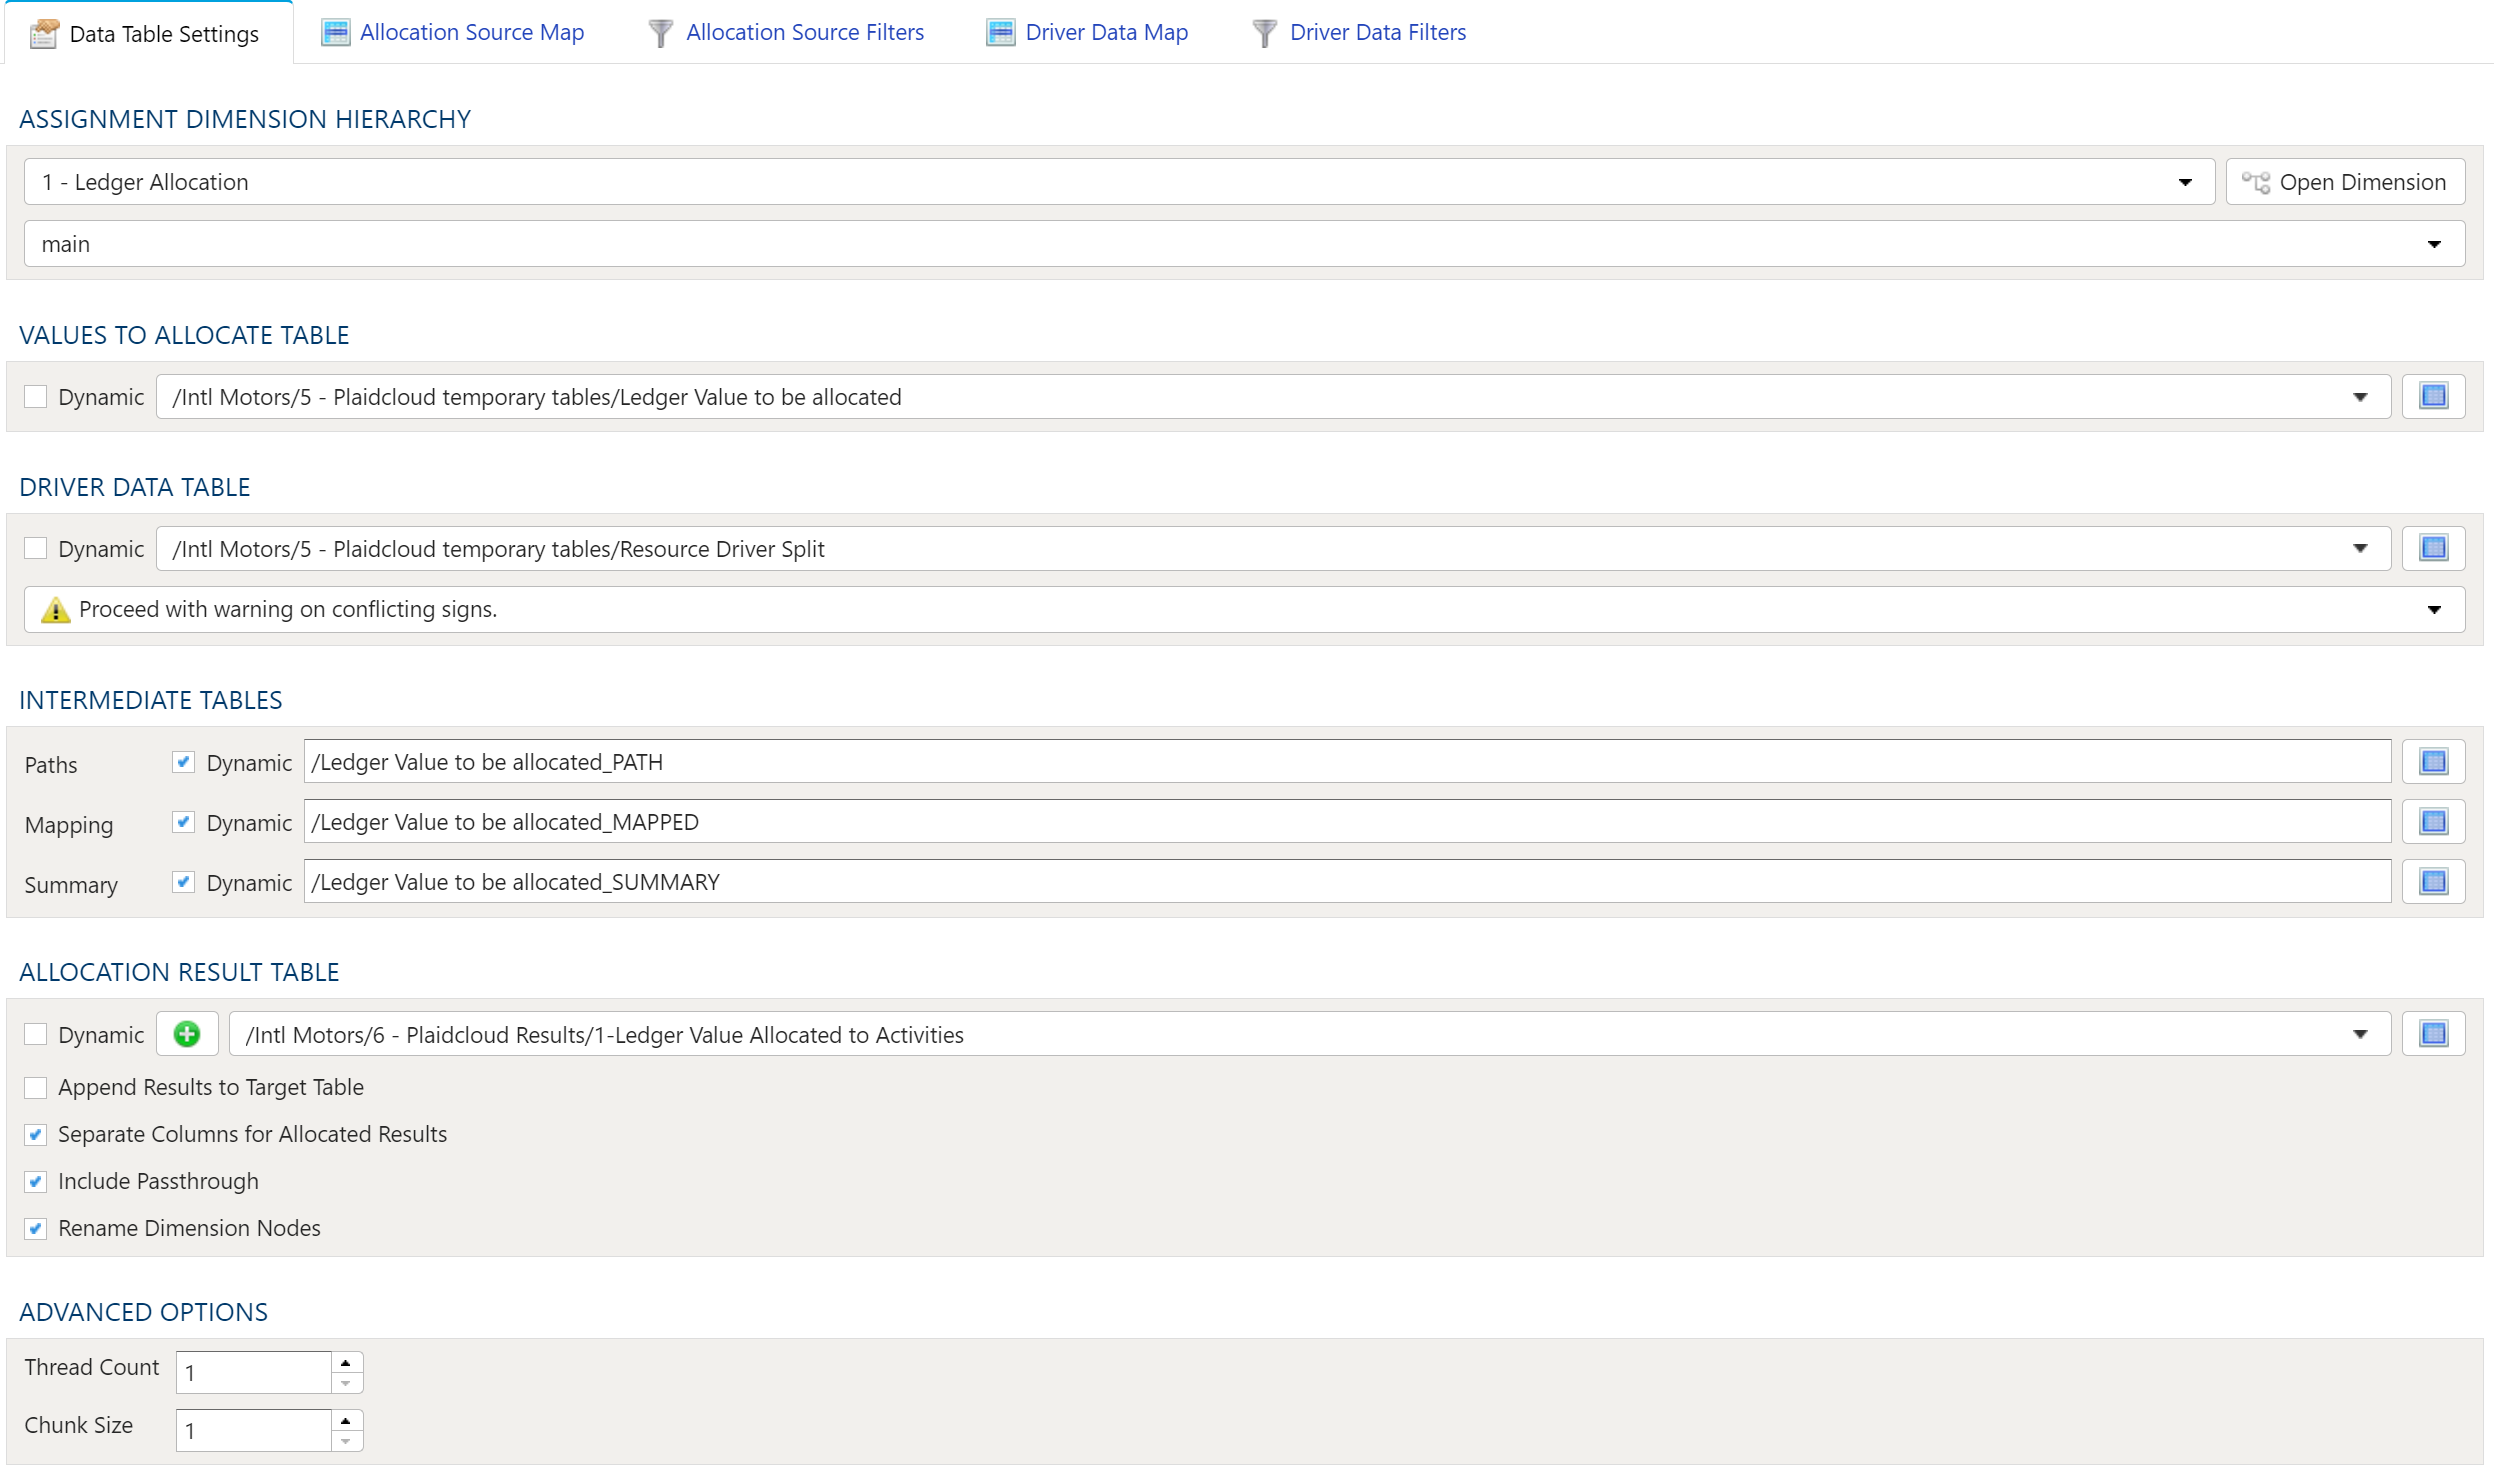
Data Table Settings
Assignment Dimesion Hierarchy
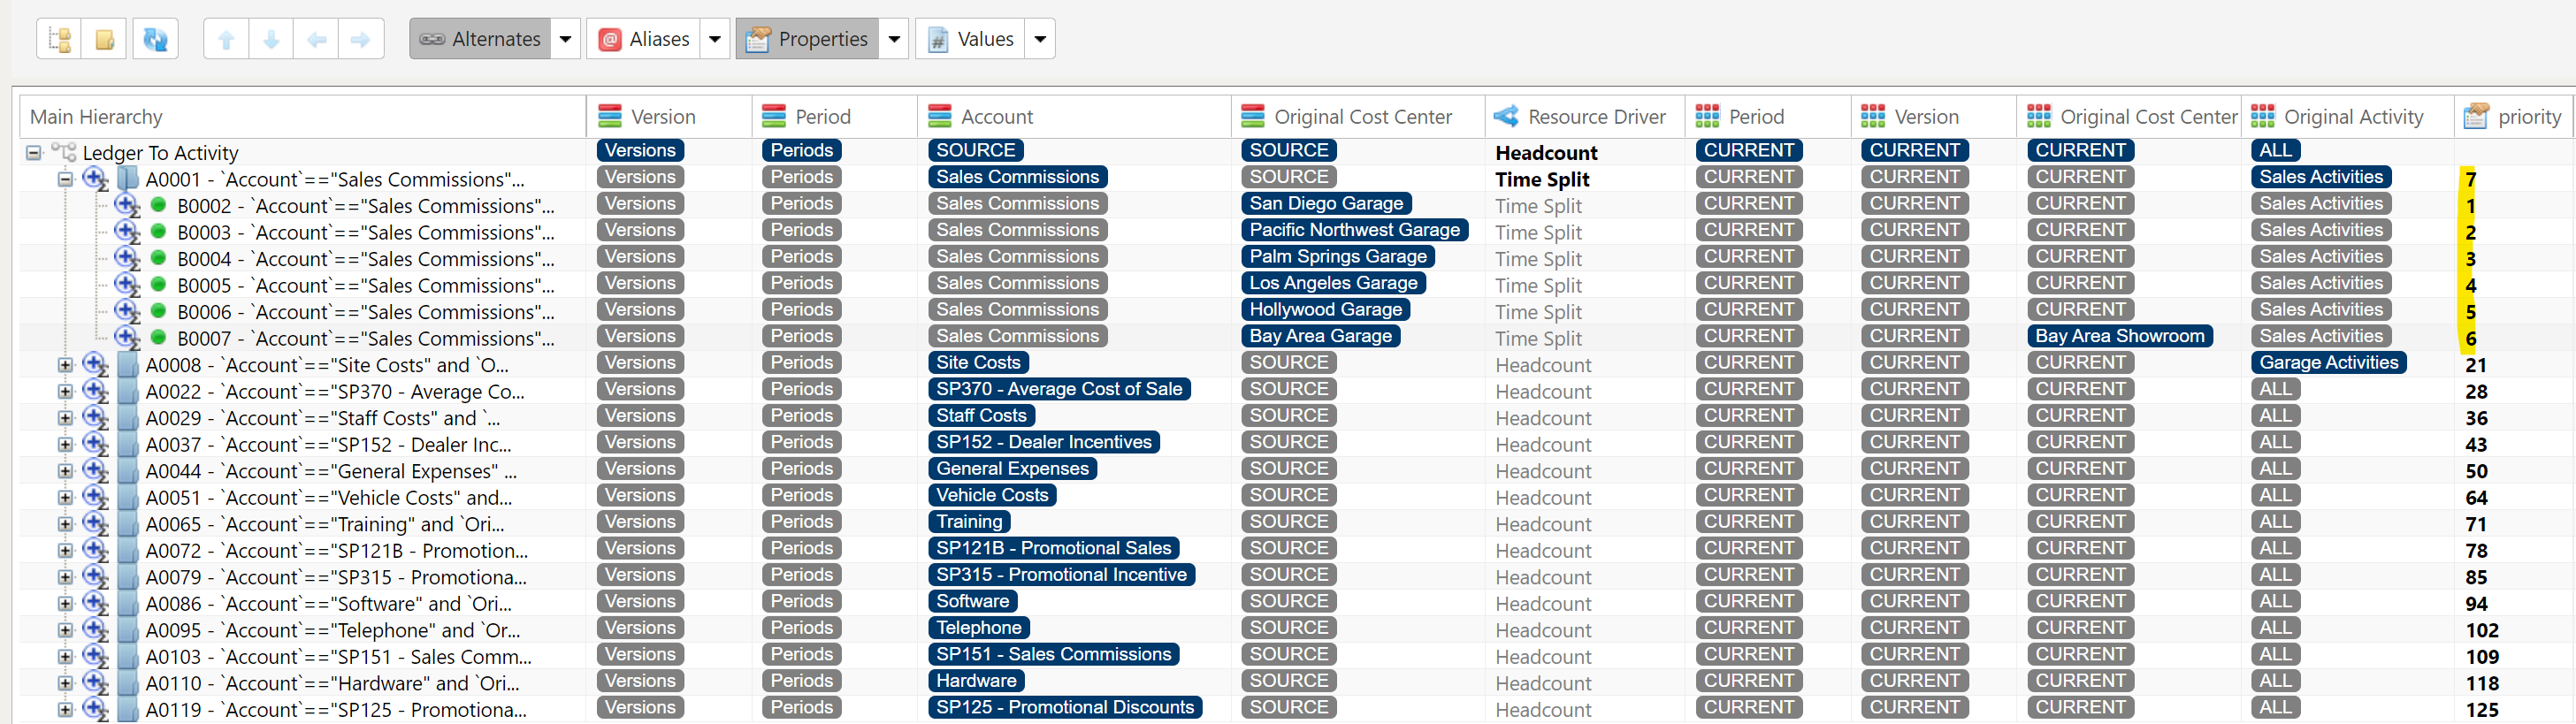
The Assignment Dimension Hierarchy gives the user the ability to point, click and filter either or both the Values To Allocate Table and Driver Data Table to create targeted allocations. The Assignment Dimension Hierarchy is created by combining dimensions that reference the Values To Allocate Table and the Driver Data Table.
Creating An Assignment Dimension Hierarchy
To create the Assignment Dimension Hierarchy you must first create the dimensions you wish to use to as filters for the Values To Allocate Table and the Driver Data Table. The links below will guide you through creating these dimensions.
Creating The Main Hierarchy
Once the dimensions for the Values To Allocate Table and the Driver Data Table have been created the next step is to decide which of the dimensions for the Values To Allocate Table will serve as the Main Hierarchy for the Assignment Dimension Hierarchy.
Copy this dimension by navigating to the Dimensions tab in PlaidCloud, clicking on the dimension and then selecting Actions and Copy Dimension. When you copy the dimension a pop-up will apprear asking you to enter a name for the copied dimension.
Adding Dimensions To The Assignment Hierarchy
Open the newley created Assignment Dimension, click on the down arrow next to Properties and select New Property.
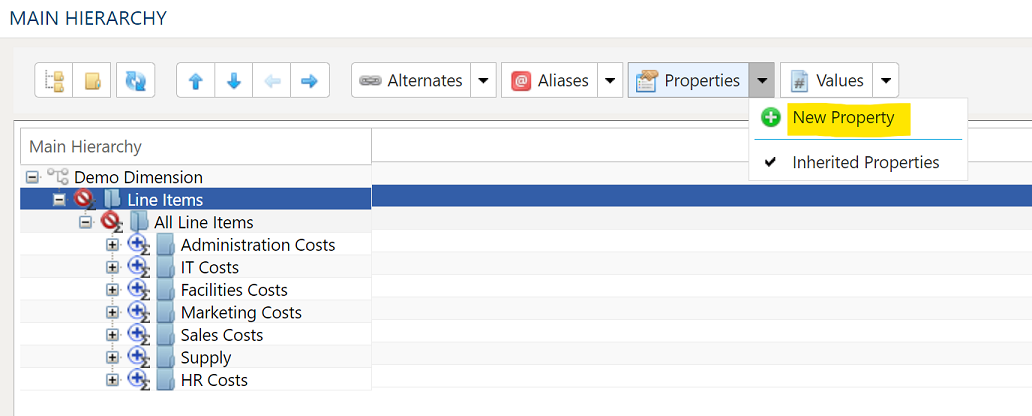
This will open the Property Configuration dialog box:
Property Configuration
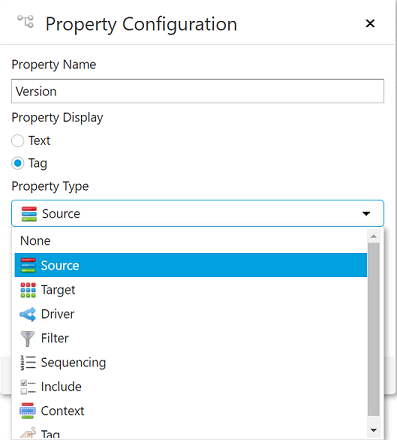
- Property Name - This is normally the name of the dimension that is being added to the Assignment Hierarchy.
- Property Display - This should be set to "Tag".
- Property Type - This property informs the allocation step which table Values To Allocate Table or the Driver Data Table this dimension is related too.
- Source - Is used in conjunction with the Values To Allocate Table.
- Target - Is used in conjunction with the Driver Data Table.
- Driver - Is used to filter Driver Data Table for the specific driver selected.
- Context - When the Values To Allocate Table and the Driver Data Table contain the same dimension then context can be used to specify how the dimensions should relate to one another. Context is often used when both the Values To Allocate Table and the Driver Data Table contain Profit / Cost Centers or Geography.
- Current - Acts as a passthrough and will filter the Driver Data Table based on the settings of the target dimension. An example would be if the Cotext is based on the Profit Center dimension and the Profit Center target dimension is set to ALL then the driver data would filter on all Profit Centers.
- Parent - When selected then the parent of the Profit Center in the Values To Allocate Table will be used to filter the driver values in the Driver Data Table. This is useful when driver values are, at times, not available for a specific Profit Center but often are at the parent level.
- All - When selected then the Profit Center in the Values To Allocate Table will not filter the driver values in the Driver Data Table, driver values for all Profit Centers will be used.Note: When Context is set to ALL or Parent it will override the setting on the target dimension.
- Editor Type - This drop down should be set to Select Dimension.
Once the appropriate properties have been selected for the dimension being added to the Assignment Hierarchy select "Edit Configuration".
Dimension Configuration
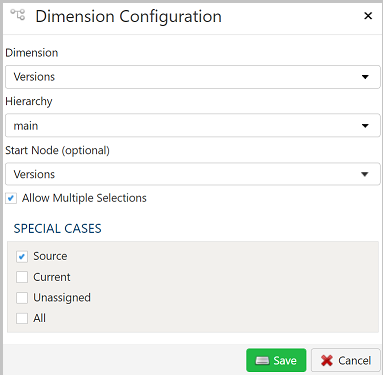
- Dimension - Use the drop down to select the dimension.
- Hierarchy - If the dimension selected has alternate hierarchies, then they will appear and be selectable here as well as the main hierarchy.
- Start Node - If you don't wish the dimension to be displayed from the top node you can select any node within the hierarchy as the node from which the dimension will be displayed.
- Allow Multiple Selections - If checked the user will be able to select multiple nodes in the hierarchy.
- Special Cases - When selected the special cases will be available for selection in the dimension drop down menu. They are typically used in Target dimensions.
- Source - When a dimension is set to Source the allocation will ignore this dimension when it filters the Driver Data Table but the allocated results will include values from the dimension.
- Current - Can be used when a dimension is shared between Source and Target. When the Target dimension is set to Current then the Driver Data Table will be filtered by the current value of the Source dimension as the allocation runs. An example would be if there are multiple periods in the Values To Allocate Table and the Driver Data Table but you want the allocation to allocate within the periods and not acrocss them. It is also common to use Current on Business Units, Cost Centers and Geographies.
- Unassigned - When a dimension is set to Unassigned the allocation will ignore this dimension when it filters the Driver Data Table and the allocation result for this dimension will be a Null value.
- All - When a dimension is set to ALL then the allocation will use all the values in the dimension.
The Values To Allocate Table, Driver Data Table and Allocation Result Table can be selected dynamically or statically.
Dynamic Table Selection
The dynamic table option allows specification of a table using text and variables. This is useful when employing variable driven workflows where the table or view references are relative to the variables specified.
An example that uses the current_month variable to dynamically point to a table:
legal_entity/inputs/{current_month}/ledger_values
Static Table Selection
When a specific table is desired as the source, leave the Dynamic box unchecked and select the source table using the dropdown menu.
Table Explorer is always avaible with any table selection. Click on the Table Explorer button to the right of the table selection and a Table Explorer window will open.
Values To Allocate Table
This is the table that contains the values that are to be allocated. These are typically cost or revenue values.
Driver Data Table
The driver data table contains the values that the allocation step will use to allocate costs.
Examples:
- For a supply chain to assign costs to customers you might use delivery data with the number of deliveries or the weight of the deliveries as the driver.
- For an IT help desk to assign its costs to the departments it supports the driver data be the number of tickets by cost center.
Driver Data Sign Rule
Driver data can contain both positive and negative values. The Driver Data Sign Rule lets you decide how conflicting signs will be handled.
- Error on conficting signs - Allocation step will produce an error and stop if conflicting signs are encountered.
- Proceed with warning on conflicting signs - Allocation step will use both negative and positive driver values but will display a warning.
- Use only positive driver values - Allocation step will only use positive driver values, will ignore negative values.
- Use only negative driver values - Allocation step will only use negative driver values, will ignore positive values.
- Use absolute values of driver data - Allocation step will use the absolute values of the driver data.
Intermediate Tables
The Intermediate Tables are created each time an allocation step runs and provides a summary of the allocation processing. The Intermediate Tables provide insight into how the alloation process is running an are used to trouble shoot unexpected results.
- Paths - Shows the number of unique allocation paths summarized from the assignment hierarchy.
- Mapping - Shows how each line of the Values To Allocate Table are mapped to the allocation targets.
- Summary - Shows each rule, as a result of the assignment hierachy, and how many of the records from the Values To Allocate Table match it.
Allocation Result Table
Append Results to Target Table
If this box is checked the allocation results will be appended to the allocation result table. If this box is not checked the allocation results table will be overwritten each time the allocation step runs.
Separate Columns for Allocated Results
If this box is checked then the results table will show the amount of each allocated record as well as the amount actually allocated to each driver record.
Rename Dimension Nodes
If this box is checked when the allocation step runs it will rename the dimension node in the Assignment dimension.
Advanced Options
Thread Count
Sets the number of concurrent operations the allocation step will use.
Chunk Size
Set the number of allocation paths within a thread.
Allocation Source Map
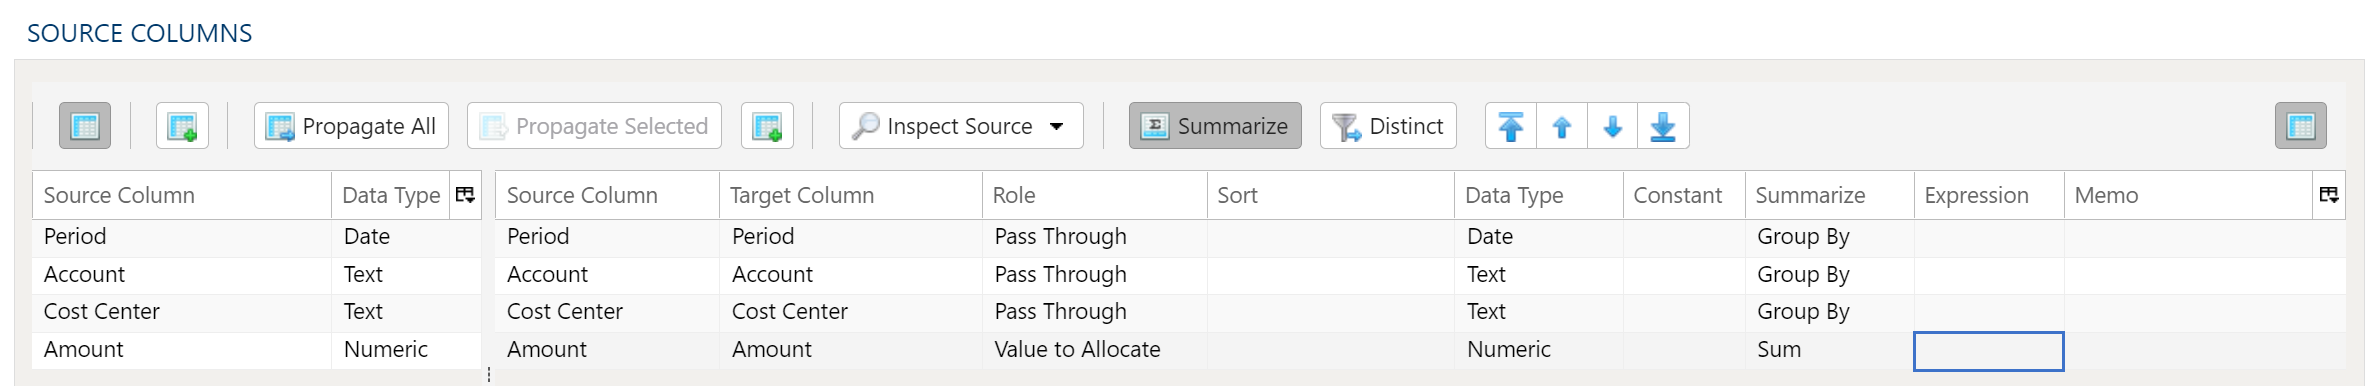
The Allocation Source Map is used to map the columns from the Values To Allocate Table that will be used in the allocation step.
Inspection and Populating the Mapper
Using the Inspect Source menu button provides additional ways to map columns from source to target:
- Populate Both Mapping Tables: Propagates all values from the source data table into the target data table. This is done by default.
- Populate Source Mapping Table Only: Maps all values in the source data table only. This is helpful when modifying an existing workflow when source column structure has changed.
- Populate Target Mapping Table Only: Propagates all values into the target data table only.
If the source and target column options aren’t enough, other columns can be added into the target data table in several different ways:
- Propagate All will insert all source columns into the target data table, whether they already existed or not.
- Propagate Selected will insert selected source column(s) only.
- Right click on target side and select Insert Row to insert a row immediately above the currently selected row.
- Right click on target side and select Append Row to insert a row at the bottom (far right) of the target data table.
Role
Each column in the data mapper must be assigned a role:
- Pass Thought - These columns will appear in the allocation results table.
- Value to Allocate - This is the column that contains the values to be allocated.
Deleting Columns
To delete columns from the target data table, select the desired column(s), then right click and select Delete.
Chaging Column Order
To rearrange columns in the target data table, select the desired column(s). You can use either:
- Bulk Move Arrows: Select the desired move option from the arrows in the upper right
- Context Menu: Right clikc and select Move to Top, Move Up, Move Down, or Move to Bottom.
Reduce Result to Distinct Records Only
To return only distinct options, select the Distinct menu option. This will toggle a set of checkboxes for each column in the source. Simply check any box next to the corresponding column to return only distinct results.
Depending on the situation, you may want to consider use of Summarization instead.
The distinct process retains the first unique record found and discards the rest. You may want to apply a sort on the data if it is important for consistency between runs.
Aggregation and Grouping
To aggregate results, select the Summarize menu option. This will toggle a set of select boxes for each column in the target data table. Choose an appropriate summarization method for each column.
- Group By
- Sum
- Min
- Max
- First
- Last
- Count
- Count (including nulls)
- Mean
- Standard Deviation
- Sample Standard Deviation
- Population Standard Deviation
- Variance
- Sample Variance
- Population Variance
- Advanced Non-Group_By
For advanced data mapper usage such as expressions, cleaning, and constants, please see the Advanced Data Mapper Usage
Allocation Source Filters
To allow for maximum flexibility, data filters are available on the source data and the target data. For larger data sets, it can be especially beneficial to filter out rows on the source so the remaining operations are performed on a smaller data set.
Select Subset Of Data
This filter type provides a way to filter the inbound source data based on the specified conditions.
Apply Secondary Filter To Result Data
This filter type provides a way to apply a filter to the post-transformed result data based on the specified conditions. The ability to apply a filter on the post-transformed result allows for exclusions based on results of complex calcuations, summarizaitons, or window functions.
Final Data Table Slicing (Limit)
The row slicing capability provides the ability to limit the rows in the result set based on a range and starting point.
Filter Syntax
The filter syntax utilizes Python SQLAlchemy which is the same syntax as other expressions.
View examples and expression functions in the Expressions area.
Driver Data Map
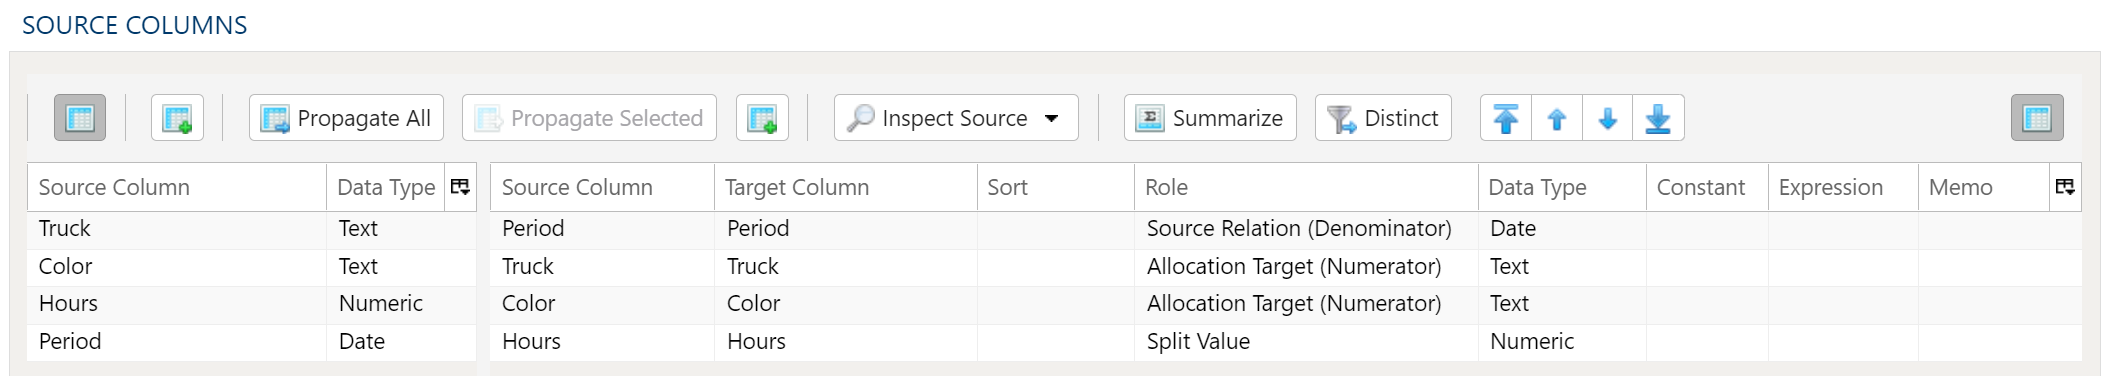
The Allocation Driver Data Map is used to map the columns from the Driver Data Table that will be used in the allocation step.
Inspection and Populating the Mapper
Using the Inspect Source menu button provides additional ways to map columns from source to target:
- Populate Both Mapping Tables: Propagates all values from the source data table into the target data table. This is done by default.
- Populate Source Mapping Table Only: Maps all values in the source data table only. This is helpful when modifying an existing workflow when source column structure has changed.
- Populate Target Mapping Table Only: Propagates all values into the target data table only.
If the source and target column options aren’t enough, other columns can be added into the target data table in several different ways:
- Propagate All will insert all source columns into the target data table, whether they already existed or not.
- Propagate Selected will insert selected source column(s) only.
- Right click on target side and select Insert Row to insert a row immediately above the currently selected row.
- Right click on target side and select Append Row to insert a row at the bottom (far right) of the target data table.
Role
Each column in the data mapper must be assigned a role:
- Source Relation - These columns have corresponing columns in the Values To Allocate Table.
- Allocation Target - The columns will be the target of the allocation step and will appear in the Allocation Result Table.
- Split Value - This column contains the values that will be used to allocate the values in the Values To Allocate Table.
Deleting Columns
To delete columns from the target data table, select the desired column(s), then right click and select Delete.
Chaging Column Order
To rearrange columns in the target data table, select the desired column(s). You can use either:
- Bulk Move Arrows: Select the desired move option from the arrows in the upper right
- Context Menu: Right clikc and select Move to Top, Move Up, Move Down, or Move to Bottom.
Reduce Result to Distinct Records Only
To return only distinct options, select the Distinct menu option. This will toggle a set of checkboxes for each column in the source. Simply check any box next to the corresponding column to return only distinct results.
Depending on the situation, you may want to consider use of Summarization instead.
The distinct process retains the first unique record found and discards the rest. You may want to apply a sort on the data if it is important for consistency between runs.
Aggregation and Grouping
To aggregate results, select the Summarize menu option. This will toggle a set of select boxes for each column in the target data table. Choose an appropriate summarization method for each column.
- Group By
- Sum
- Min
- Max
- First
- Last
- Count
- Count (including nulls)
- Mean
- Standard Deviation
- Sample Standard Deviation
- Population Standard Deviation
- Variance
- Sample Variance
- Population Variance
- Advanced Non-Group_By
For advanced data mapper usage such as expressions, cleaning, and constants, please see the Advanced Data Mapper Usage
Driver Data Filters
To allow for maximum flexibility, data filters are available on the source data and the target data. For larger data sets, it can be especially beneficial to filter out rows on the source so the remaining operations are performed on a smaller data set.
Select Subset Of Data
This filter type provides a way to filter the inbound source data based on the specified conditions.
Apply Secondary Filter To Result Data
This filter type provides a way to apply a filter to the post-transformed result data based on the specified conditions. The ability to apply a filter on the post-transformed result allows for exclusions based on results of complex calcuations, summarizaitons, or window functions.
Final Data Table Slicing (Limit)
The row slicing capability provides the ability to limit the rows in the result set based on a range and starting point.
Filter Syntax
The filter syntax utilizes Python SQLAlchemy which is the same syntax as other expressions.
View examples and expression functions in the Expressions area.
Examples
Example 1
Values To Allocate Table
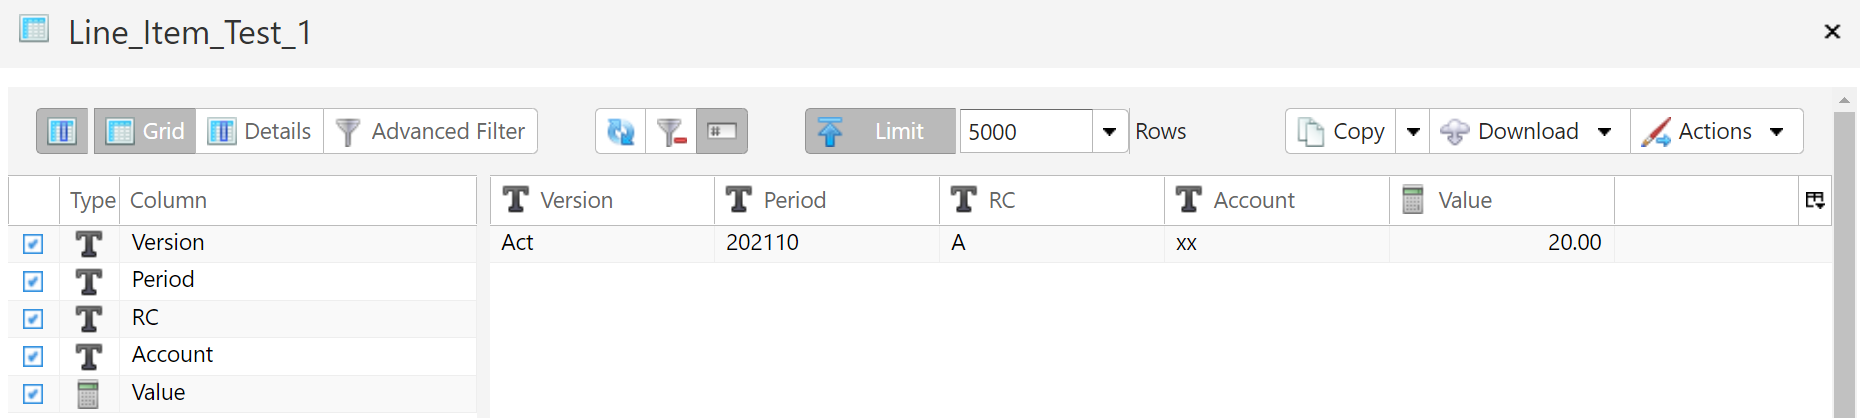
Driver Data Table
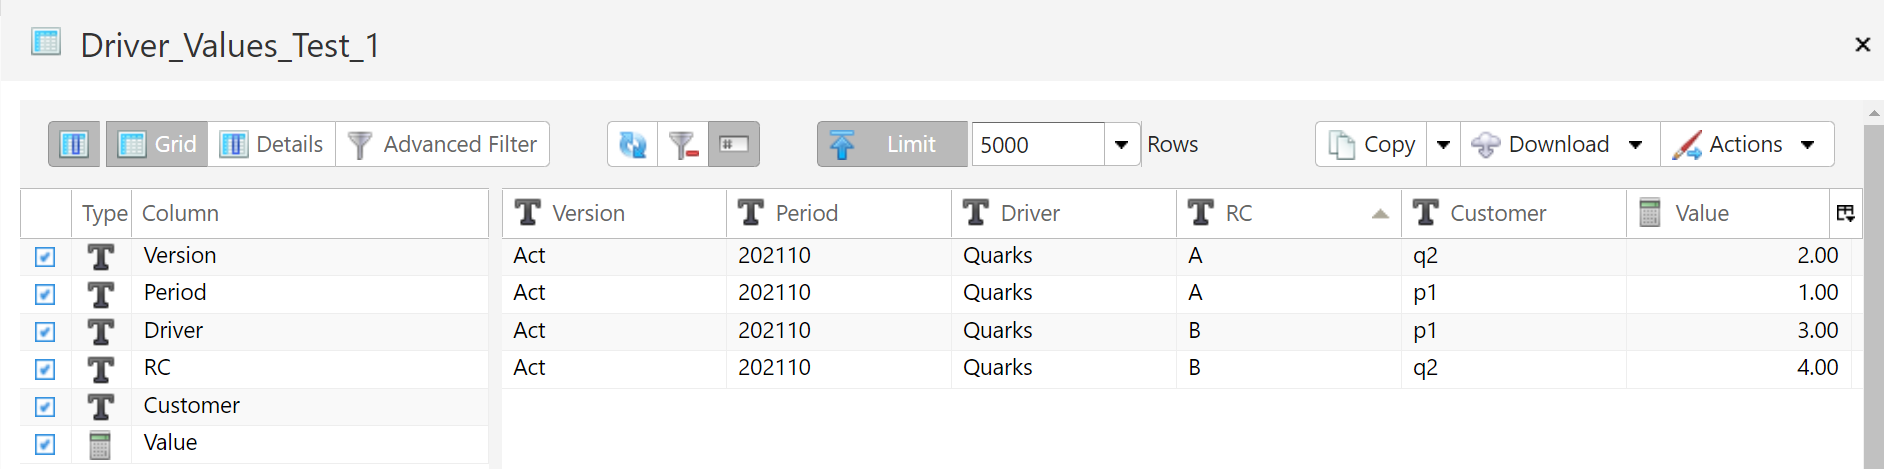
Assignment Dimension Hierarchy
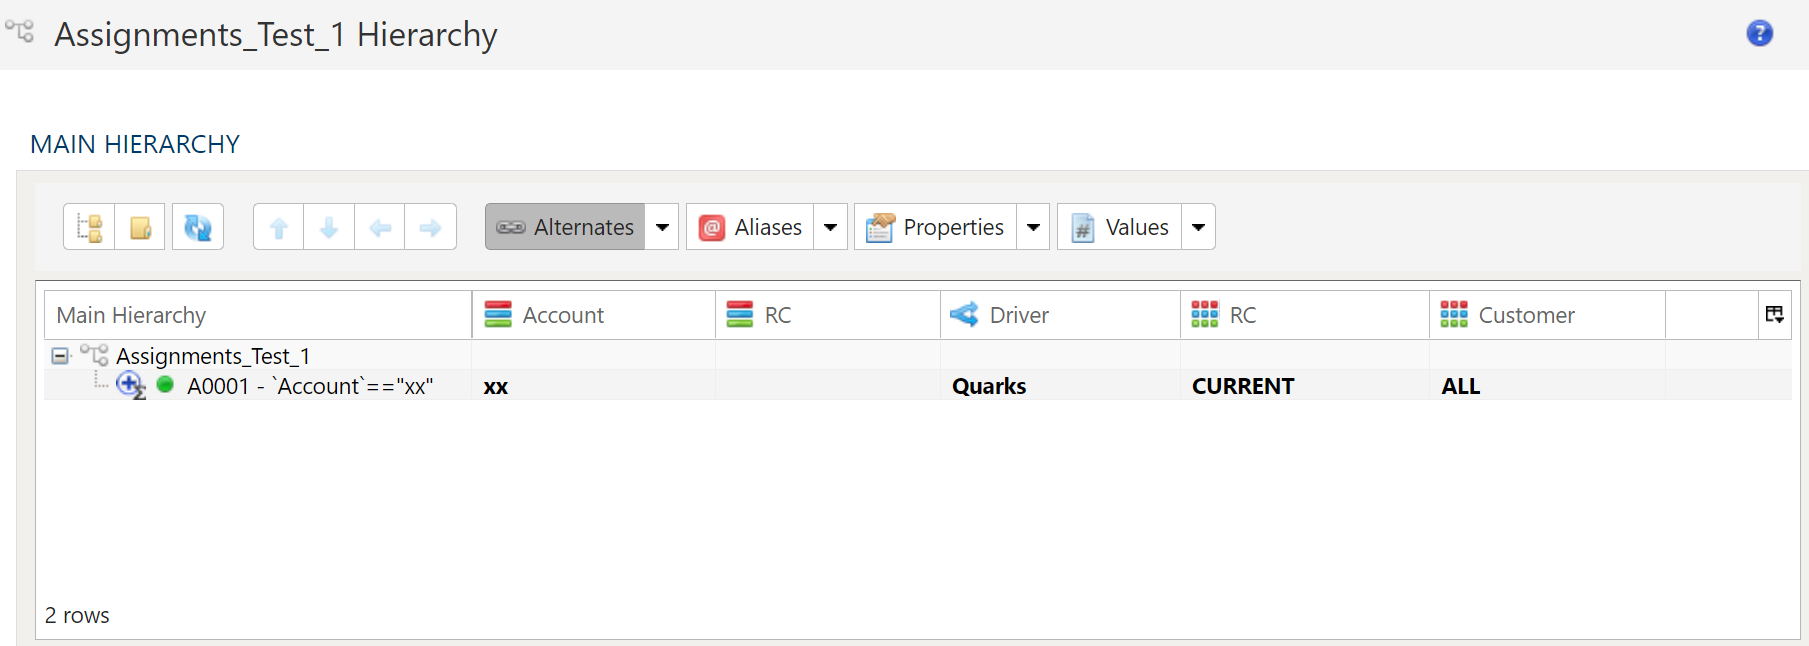
Since the Target RC dimension is set to Current the driver data will be filtered by the Source RC values in the Values To Allocation Table. Since the only value in the Source RC is "A", only the driver value records where RC = A will be used in the allocation step.
Allocation Results Table
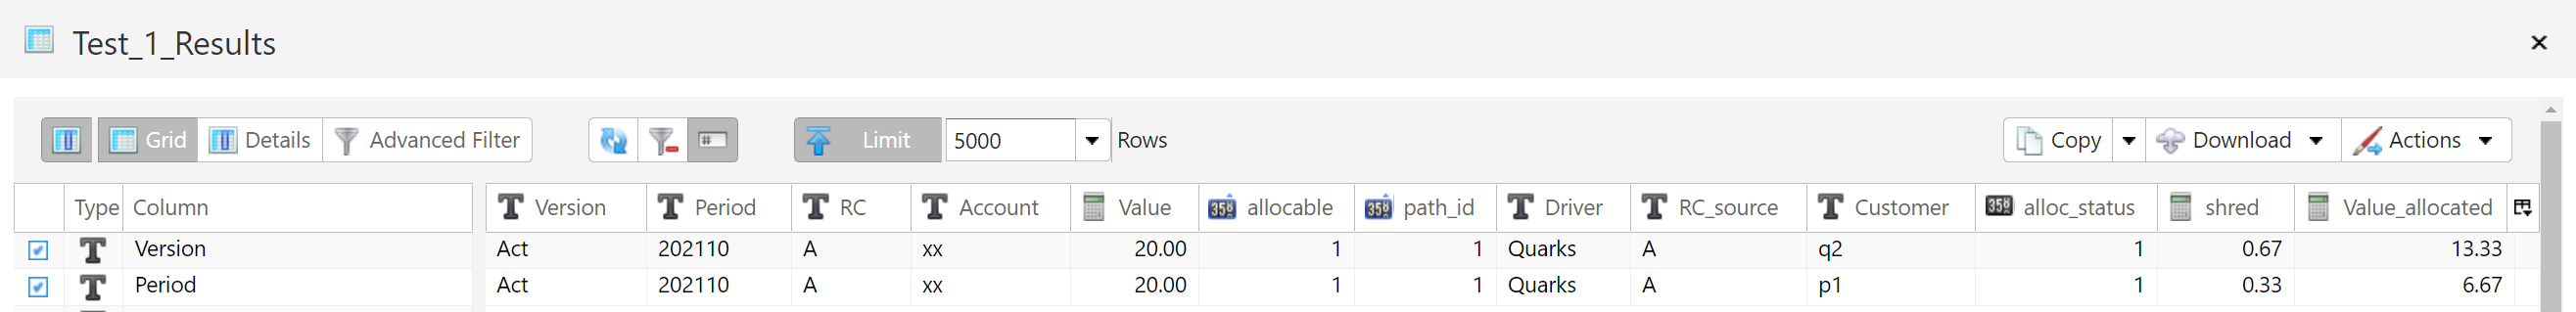
Example 2
Values To Allocate Table
Driver Data Table
Assignment Dimension Hierarchy
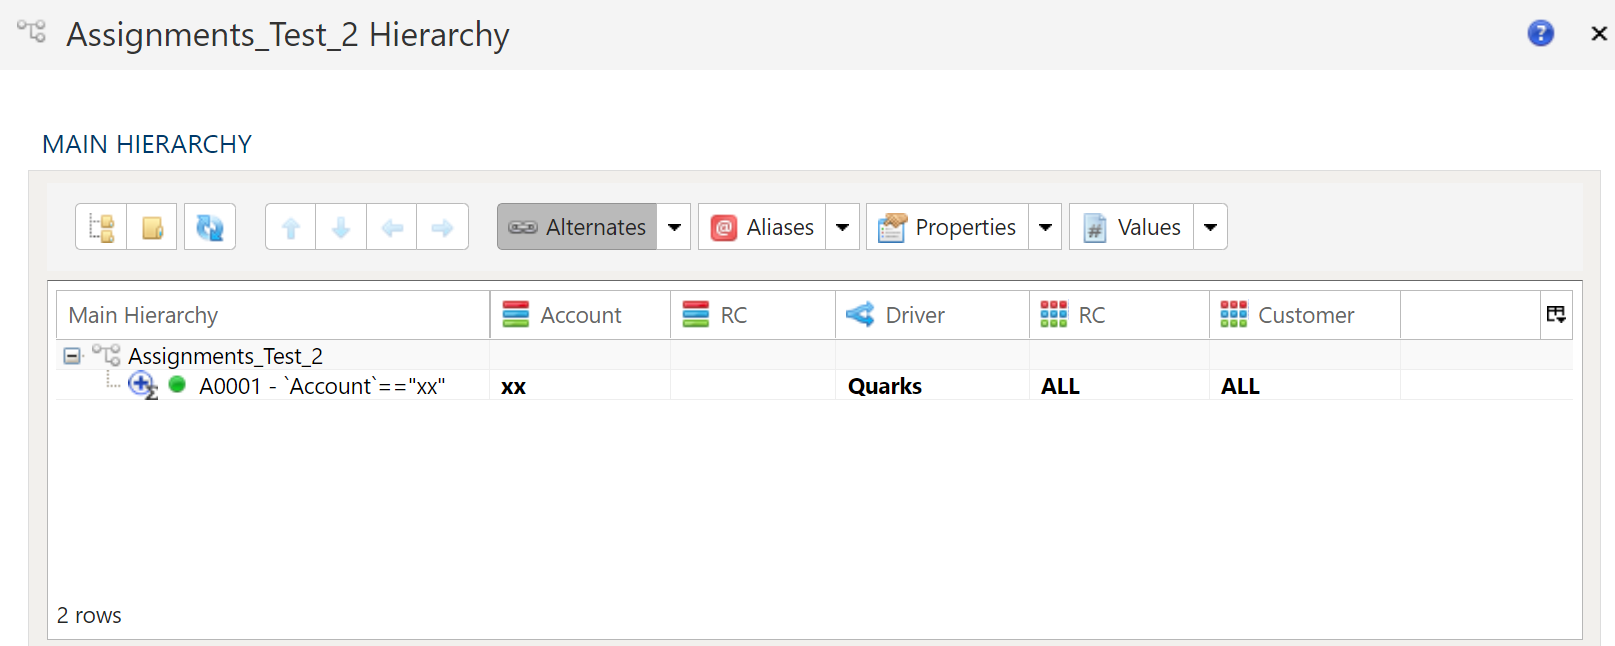
Since the Target RC dimension is set to ALL the driver data will include all RC values as you can see in the RC column in the Allocation Results Table.
Allocation Results Table
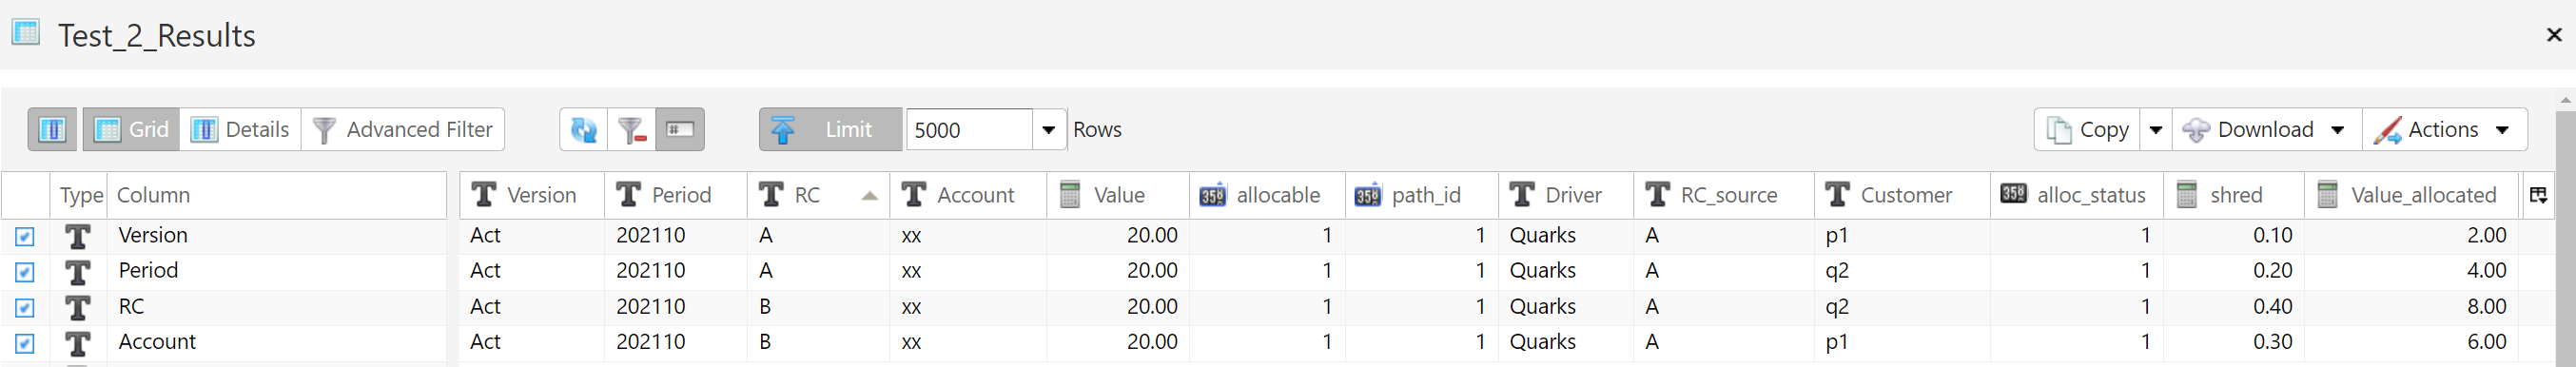
Example 3
Values To Allocate Table
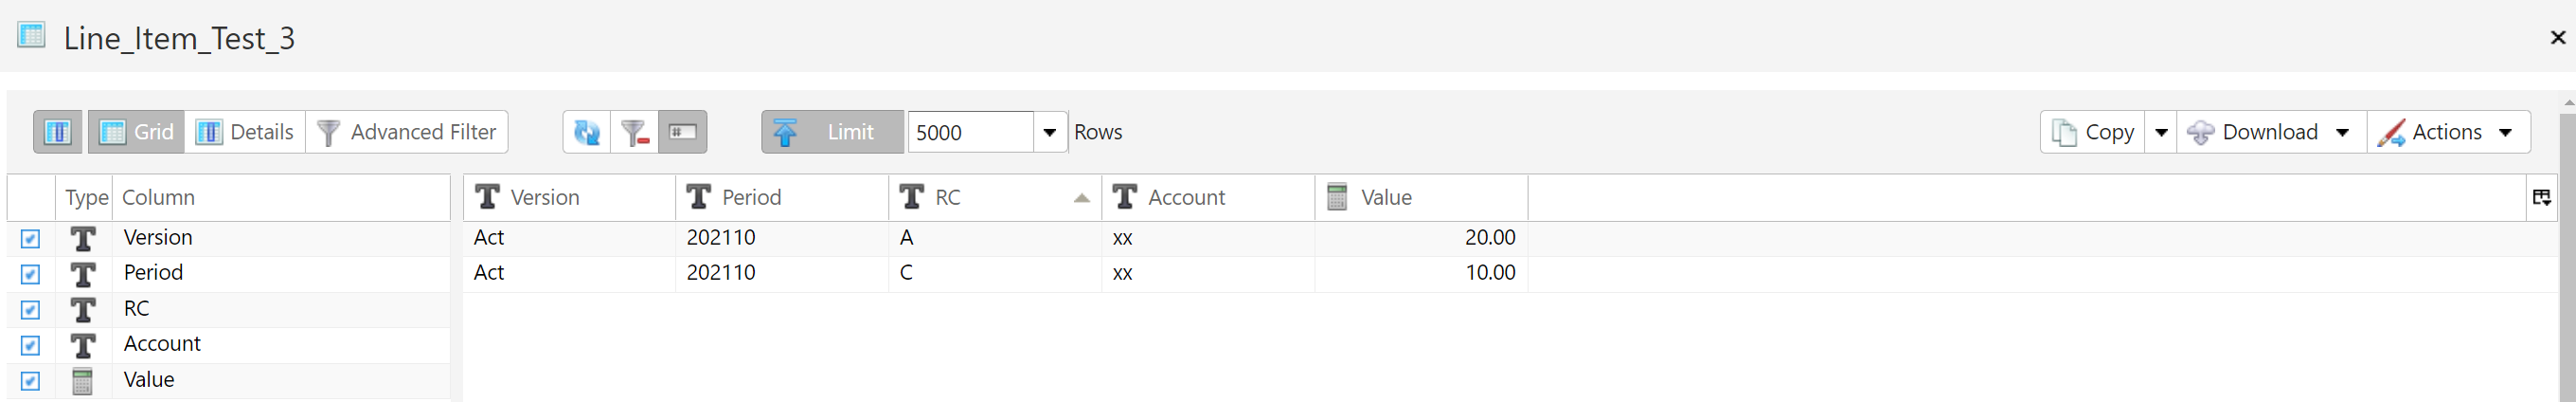
Driver Data Table
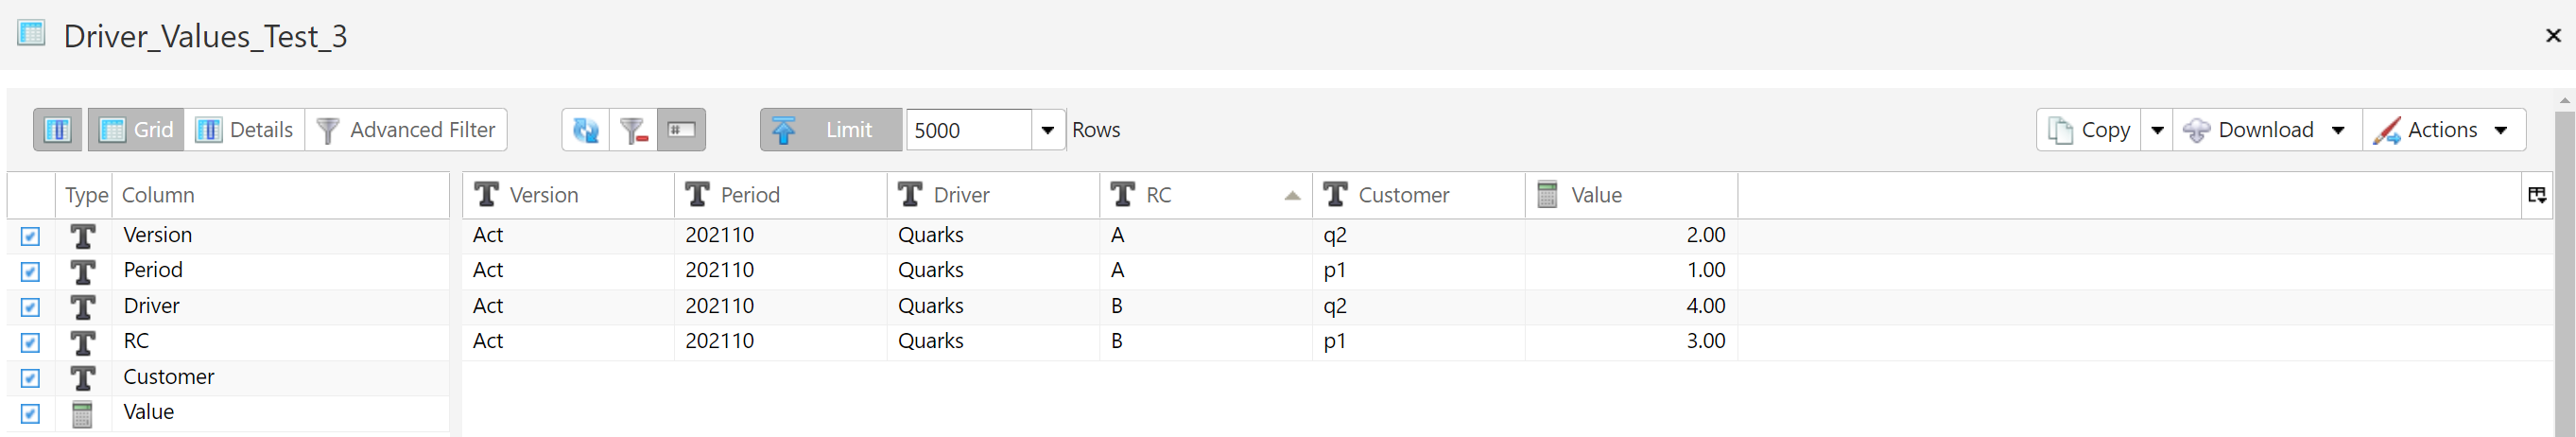
Assignment Dimension Hierarchy
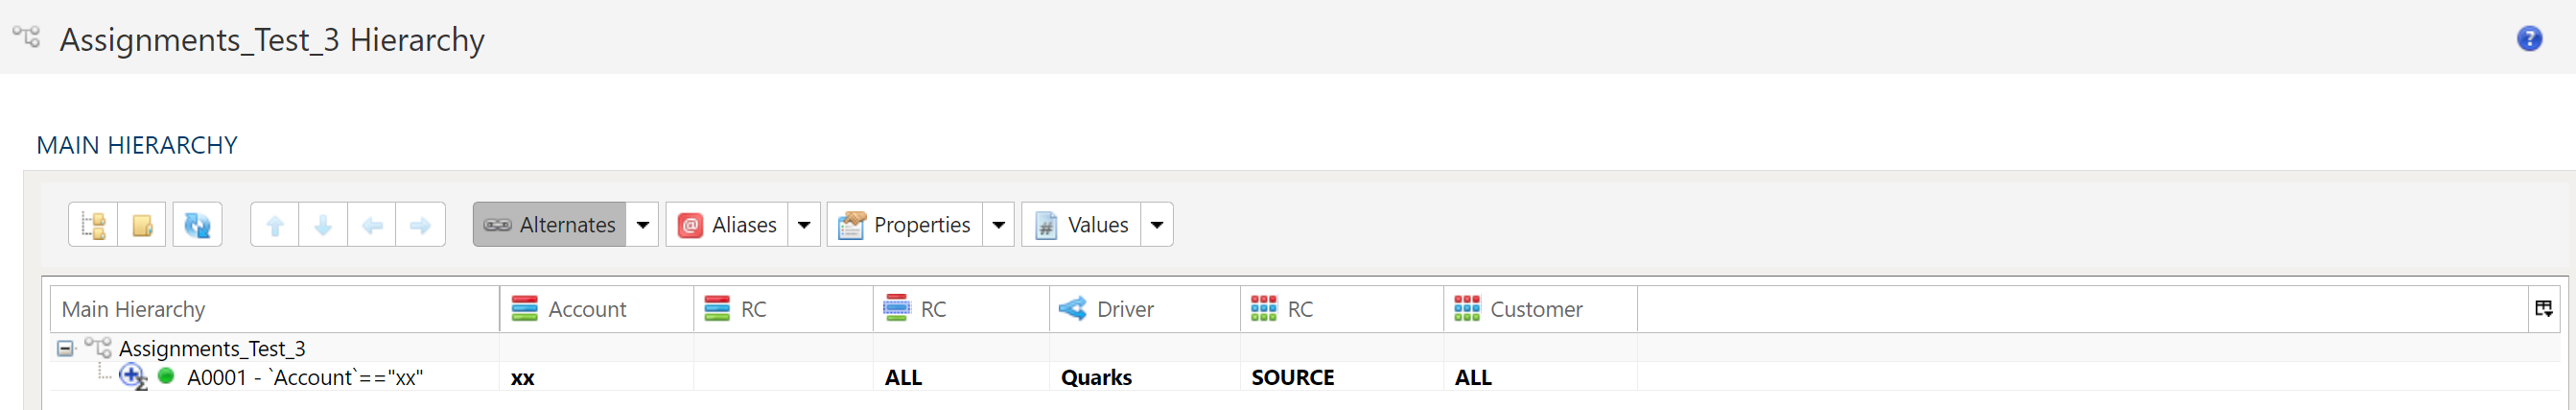
With the Context RC set to ALL and the Target RC set to Source the driver data will include all the RC in the driver data. The Contect RC will override the setting on the Target RC.
Allocation Results Table
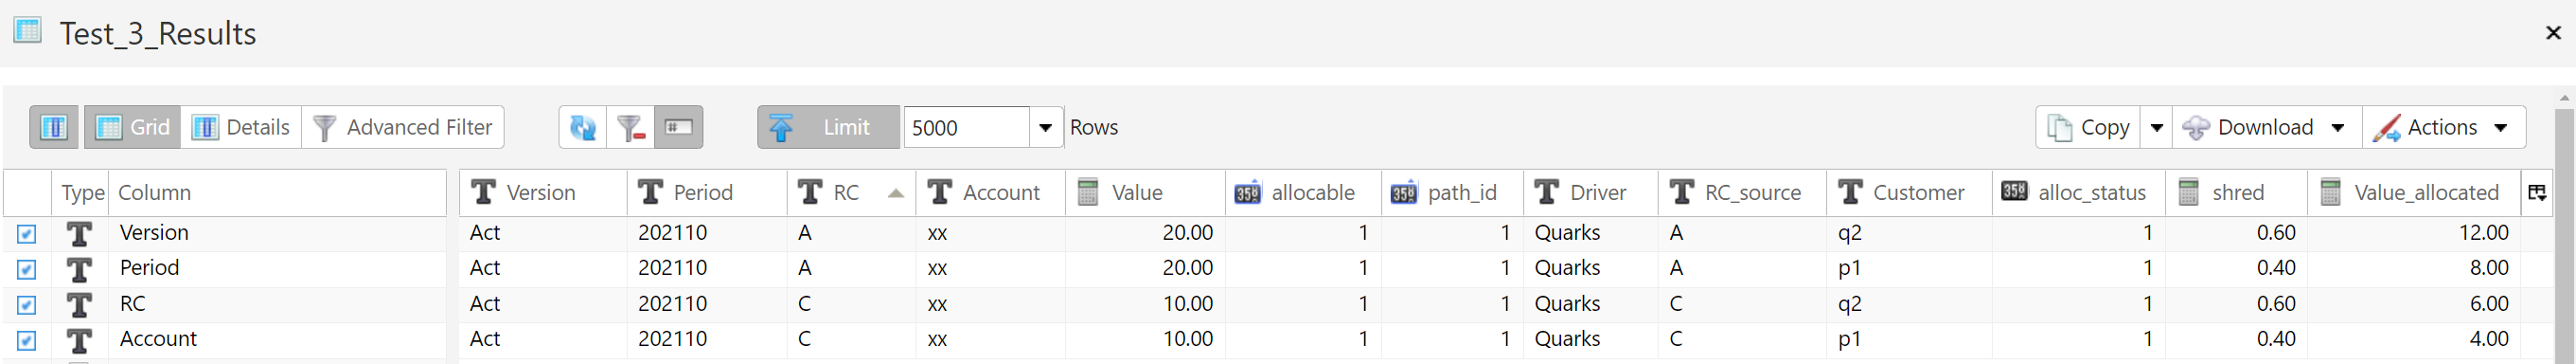
Example 4
Values To Allocate Table
Driver Data Table
Assignment Dimension Hierarchy
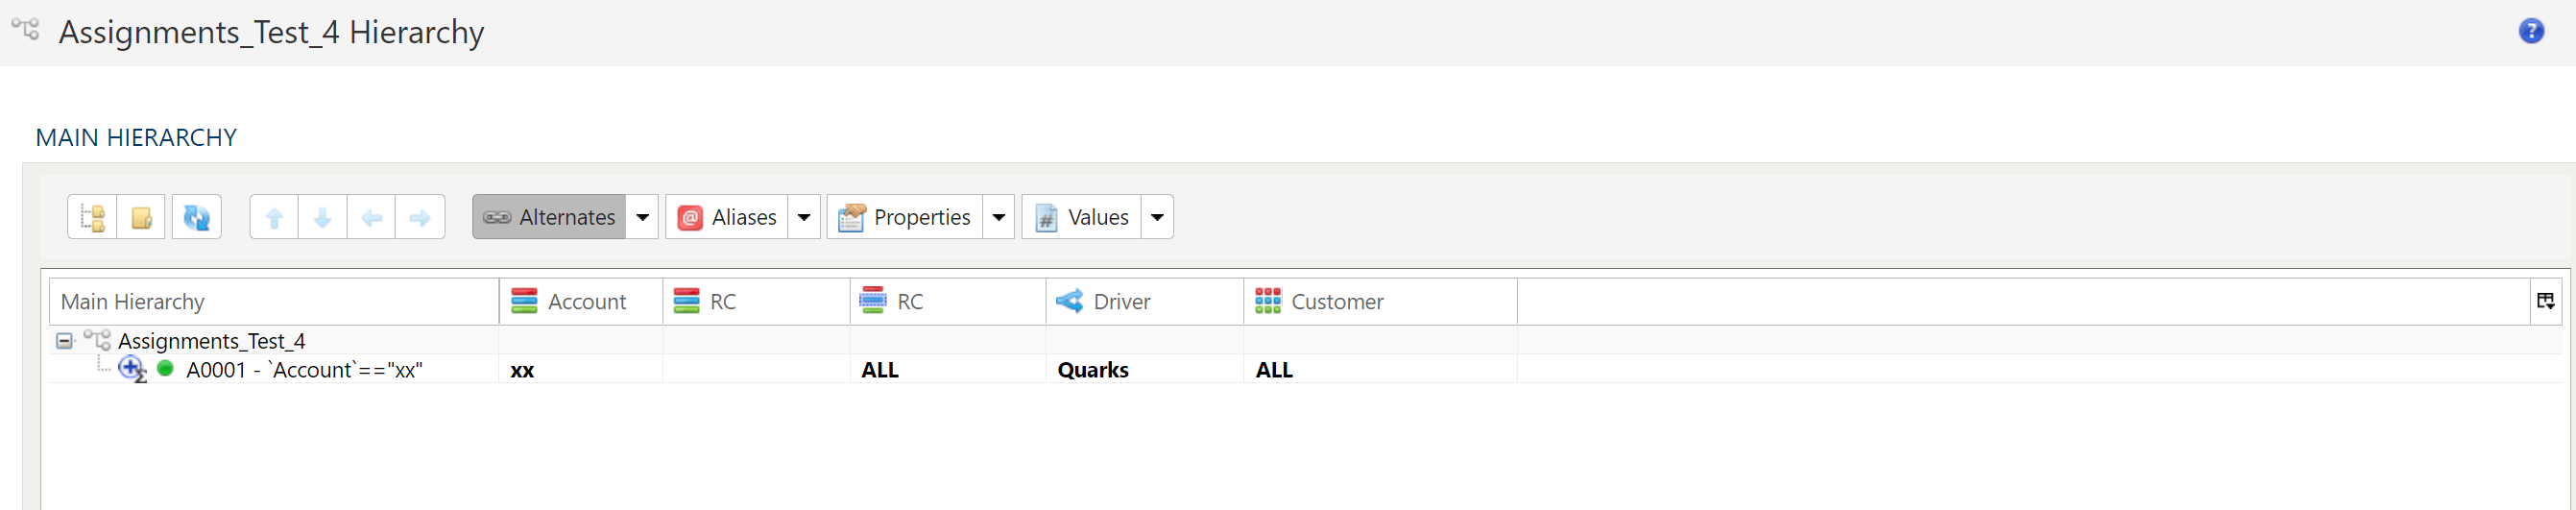
With the Context RC set to ALL the driver data will include all the RC in the driver data.
Allocation Results Table
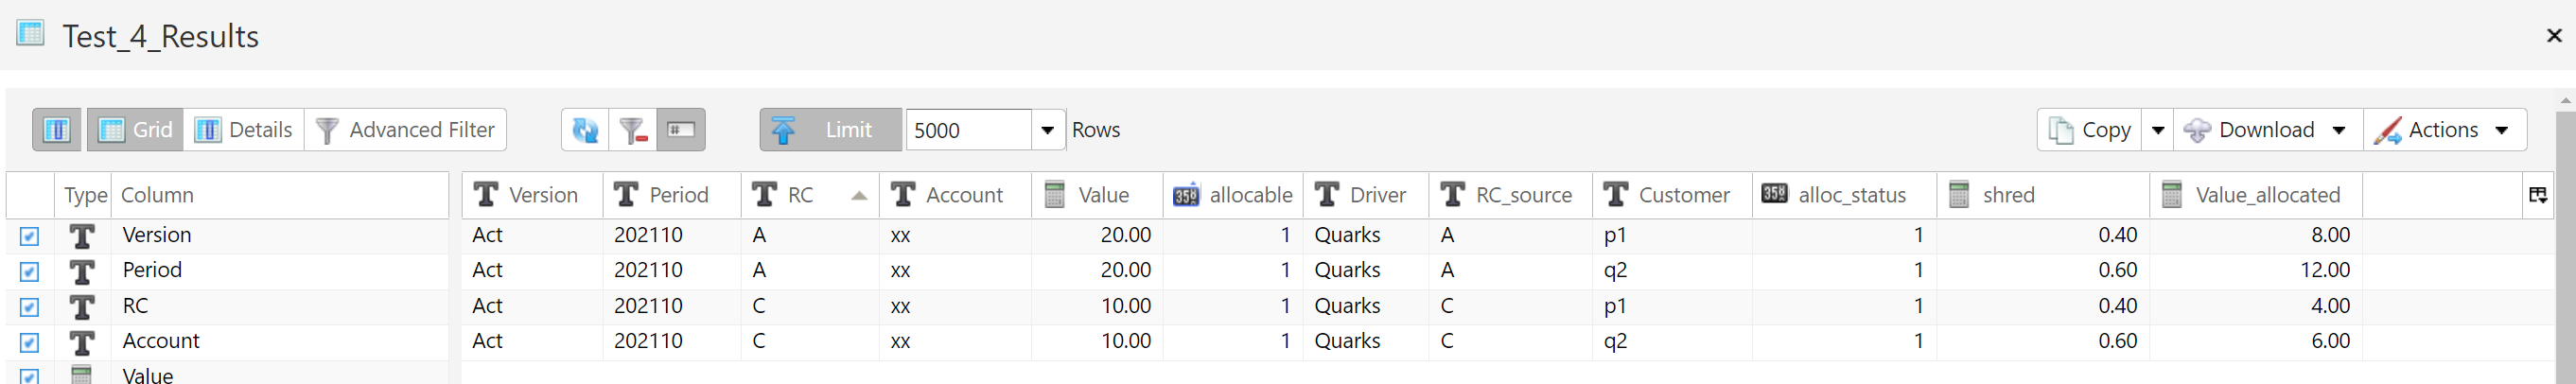
4.13 - Allocation Split
Description
Allocate values based on driver data.
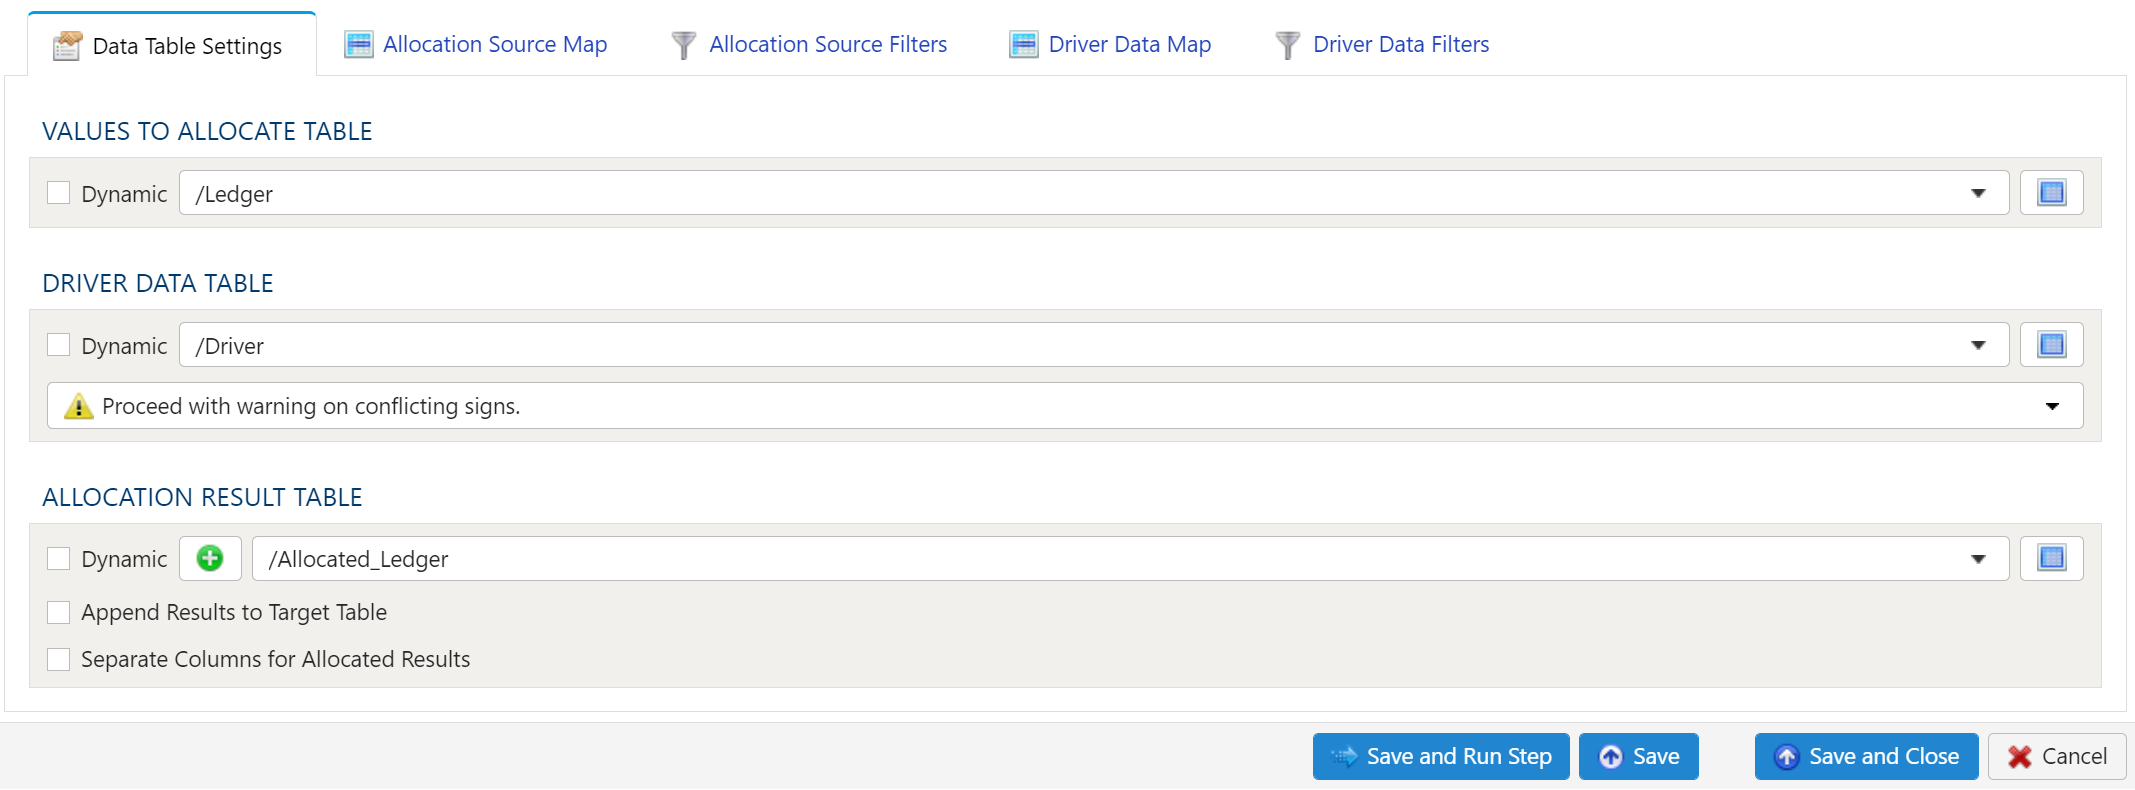
Data Table Settings
The Values To Allocate Table, Driver Data Table and Allocation Result Table can be selected dynamically or statically.
Dynamic Table Selection
The dynamic table option allows specification of a table using text and variables. This is useful when employing variable driven workflows where the table or view references are relative to the variables specified.
An example that uses the current_month variable to dynamically point to a table:
legal_entity/inputs/{current_month}/ledger_values
Static Table Selection
When a specific table is desired as the source, leave the Dynamic box unchecked and select the source table using the dropdown menu.
Table Explorer is always avaible with any table selection. Click on the Table Explorer button to the right of the table selection and a Table Explorer window will open.
Values To Allocate Table
This is the table that contains the values that are to be allocated. These are typically cost or revenue values.
Driver Data Table
The driver data table contains the values that the allocation step will use to allocate costs.
Examples:
- For a supply chain to assign costs to customers you might use delivery data with the number of deliveries or the weight of the deliveries as the driver.
- For an IT help desk to assign its costs to the departments it supports the driver data be the number of tickets by cost center.
Driver Data Sign Rule
Driver data can contain both positive and negative values. The Driver Data Sign Rule lets you decide how conflicting signs will be handled.
- Error on conficting signs - Allocation step will produce an error and stop if conflicting signs are encountered.
- Proceed with warning on conflicting signs - Allocation step will use both negative and positive driver values but will display a warning.
- Use only positive driver values - Allocation step will only use positive driver values, will ignore negative values.
- Use only negative driver values - Allocation step will only use negative driver values, will ignore positive values.
- Use absolute values of driver data - Allocation step will use the absolute values of the driver data.
Allocation Result Table
Append Results to Target Table
If this box is checked the allocation results will be appended to the allocation result table. If this box is not checked the allocation results table will be overwritten each time the allocation step runs.
Separate Columns for Allocated Results
If this box is checked then the results table will show the amount of each allocated record as well as the amount actually allocated to each driver record.
Allocation Source Map
The Allocation Source Map is used to map the columns from the Values To Allocate Table that will be used in the allocation step.
Inspection and Populating the Mapper
Using the Inspect Source menu button provides additional ways to map columns from source to target:
- Populate Both Mapping Tables: Propagates all values from the source data table into the target data table. This is done by default.
- Populate Source Mapping Table Only: Maps all values in the source data table only. This is helpful when modifying an existing workflow when source column structure has changed.
- Populate Target Mapping Table Only: Propagates all values into the target data table only.
If the source and target column options aren’t enough, other columns can be added into the target data table in several different ways:
- Propagate All will insert all source columns into the target data table, whether they already existed or not.
- Propagate Selected will insert selected source column(s) only.
- Right click on target side and select Insert Row to insert a row immediately above the currently selected row.
- Right click on target side and select Append Row to insert a row at the bottom (far right) of the target data table.
Role
Each column in the data mapper must be assigned a role:
- Pass Thought - These columns will appear in the allocation results table.
- Value to Allocate - This is the column that contains the values to be allocated.
Deleting Columns
To delete columns from the target data table, select the desired column(s), then right click and select Delete.
Chaging Column Order
To rearrange columns in the target data table, select the desired column(s). You can use either:
- Bulk Move Arrows: Select the desired move option from the arrows in the upper right
- Context Menu: Right clikc and select Move to Top, Move Up, Move Down, or Move to Bottom.
Reduce Result to Distinct Records Only
To return only distinct options, select the Distinct menu option. This will toggle a set of checkboxes for each column in the source. Simply check any box next to the corresponding column to return only distinct results.
Depending on the situation, you may want to consider use of Summarization instead.
The distinct process retains the first unique record found and discards the rest. You may want to apply a sort on the data if it is important for consistency between runs.
Aggregation and Grouping
To aggregate results, select the Summarize menu option. This will toggle a set of select boxes for each column in the target data table. Choose an appropriate summarization method for each column.
- Group By
- Sum
- Min
- Max
- First
- Last
- Count
- Count (including nulls)
- Mean
- Standard Deviation
- Sample Standard Deviation
- Population Standard Deviation
- Variance
- Sample Variance
- Population Variance
- Advanced Non-Group_By
For advanced data mapper usage such as expressions, cleaning, and constants, please see the Advanced Data Mapper Usage
Allocation Source Filters
To allow for maximum flexibility, data filters are available on the source data and the target data. For larger data sets, it can be especially beneficial to filter out rows on the source so the remaining operations are performed on a smaller data set.
Select Subset Of Data
This filter type provides a way to filter the inbound source data based on the specified conditions.
Apply Secondary Filter To Result Data
This filter type provides a way to apply a filter to the post-transformed result data based on the specified conditions. The ability to apply a filter on the post-transformed result allows for exclusions based on results of complex calcuations, summarizaitons, or window functions.
Final Data Table Slicing (Limit)
The row slicing capability provides the ability to limit the rows in the result set based on a range and starting point.
Filter Syntax
The filter syntax utilizes Python SQLAlchemy which is the same syntax as other expressions.
View examples and expression functions in the Expressions area.
Driver Data Map
The Allocation Driver Data Map is used to map the columns from the Driver Data Table that will be used in the allocation step.
Inspection and Populating the Mapper
Using the Inspect Source menu button provides additional ways to map columns from source to target:
- Populate Both Mapping Tables: Propagates all values from the source data table into the target data table. This is done by default.
- Populate Source Mapping Table Only: Maps all values in the source data table only. This is helpful when modifying an existing workflow when source column structure has changed.
- Populate Target Mapping Table Only: Propagates all values into the target data table only.
If the source and target column options aren’t enough, other columns can be added into the target data table in several different ways:
- Propagate All will insert all source columns into the target data table, whether they already existed or not.
- Propagate Selected will insert selected source column(s) only.
- Right click on target side and select Insert Row to insert a row immediately above the currently selected row.
- Right click on target side and select Append Row to insert a row at the bottom (far right) of the target data table.
Role
Each column in the data mapper must be assigned a role:
- Source Relation - These columns have corresponing columns in the Values To Allocate Table.
- Allocation Target - The columns will be the target of the allocation step and will appear in the Allocation Result Table.
- Split Value - This column contains the values that will be used to allocate the values in the Values To Allocate Table.
Deleting Columns
To delete columns from the target data table, select the desired column(s), then right click and select Delete.
Chaging Column Order
To rearrange columns in the target data table, select the desired column(s). You can use either:
- Bulk Move Arrows: Select the desired move option from the arrows in the upper right
- Context Menu: Right clikc and select Move to Top, Move Up, Move Down, or Move to Bottom.
Reduce Result to Distinct Records Only
To return only distinct options, select the Distinct menu option. This will toggle a set of checkboxes for each column in the source. Simply check any box next to the corresponding column to return only distinct results.
Depending on the situation, you may want to consider use of Summarization instead.
The distinct process retains the first unique record found and discards the rest. You may want to apply a sort on the data if it is important for consistency between runs.
Aggregation and Grouping
To aggregate results, select the Summarize menu option. This will toggle a set of select boxes for each column in the target data table. Choose an appropriate summarization method for each column.
- Group By
- Sum
- Min
- Max
- First
- Last
- Count
- Count (including nulls)
- Mean
- Standard Deviation
- Sample Standard Deviation
- Population Standard Deviation
- Variance
- Sample Variance
- Population Variance
- Advanced Non-Group_By
For advanced data mapper usage such as expressions, cleaning, and constants, please see the Advanced Data Mapper Usage
Driver Data Filters
To allow for maximum flexibility, data filters are available on the source data and the target data. For larger data sets, it can be especially beneficial to filter out rows on the source so the remaining operations are performed on a smaller data set.
Select Subset Of Data
This filter type provides a way to filter the inbound source data based on the specified conditions.
Apply Secondary Filter To Result Data
This filter type provides a way to apply a filter to the post-transformed result data based on the specified conditions. The ability to apply a filter on the post-transformed result allows for exclusions based on results of complex calcuations, summarizaitons, or window functions.
Final Data Table Slicing (Limit)
The row slicing capability provides the ability to limit the rows in the result set based on a range and starting point.
Filter Syntax
The filter syntax utilizes Python SQLAlchemy which is the same syntax as other expressions.
View examples and expression functions in the Expressions area.
4.14 - Rule-Based Tagging
Description
Rule Based Tagging is used to add attributes contained within a dimesion to a data table.
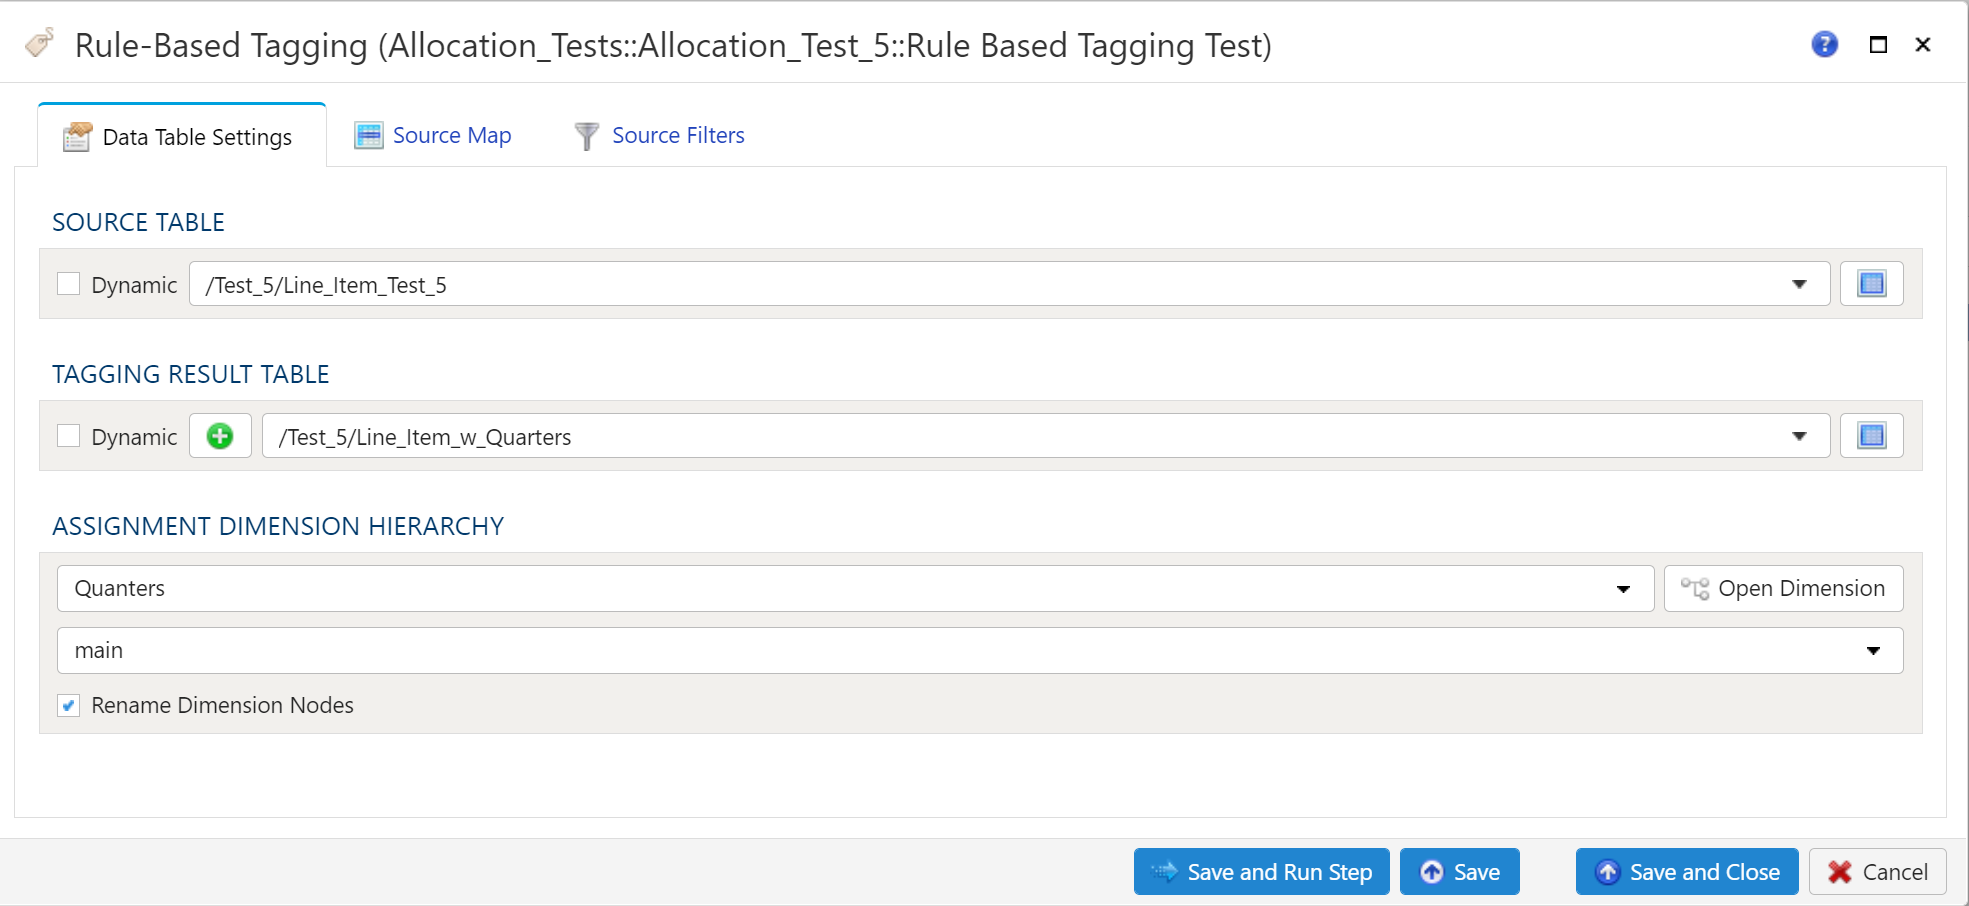
Data Table Settings
The Source Table and Tagging Result Table can be selected dynamically or statically.
Dynamic Table Selection
The dynamic table option allows specification of a table using text and variables. This is useful when employing variable driven workflows where the table or view references are relative to the variables specified.
An example that uses the current_month variable to dynamically point to a table:
legal_entity/inputs/{current_month}/ledger_values
Static Table Selection
When a specific table is desired as the source, leave the Dynamic box unchecked and select the source table using the dropdown menu.
Table Explorer is always avaible with any table selection. Click on the Table Explorer button to the right of the table selection and a Table Explorer window will open.
Source Table
This is the table that contains the data that you wish to add the attributes from the Assignment Dimension to.
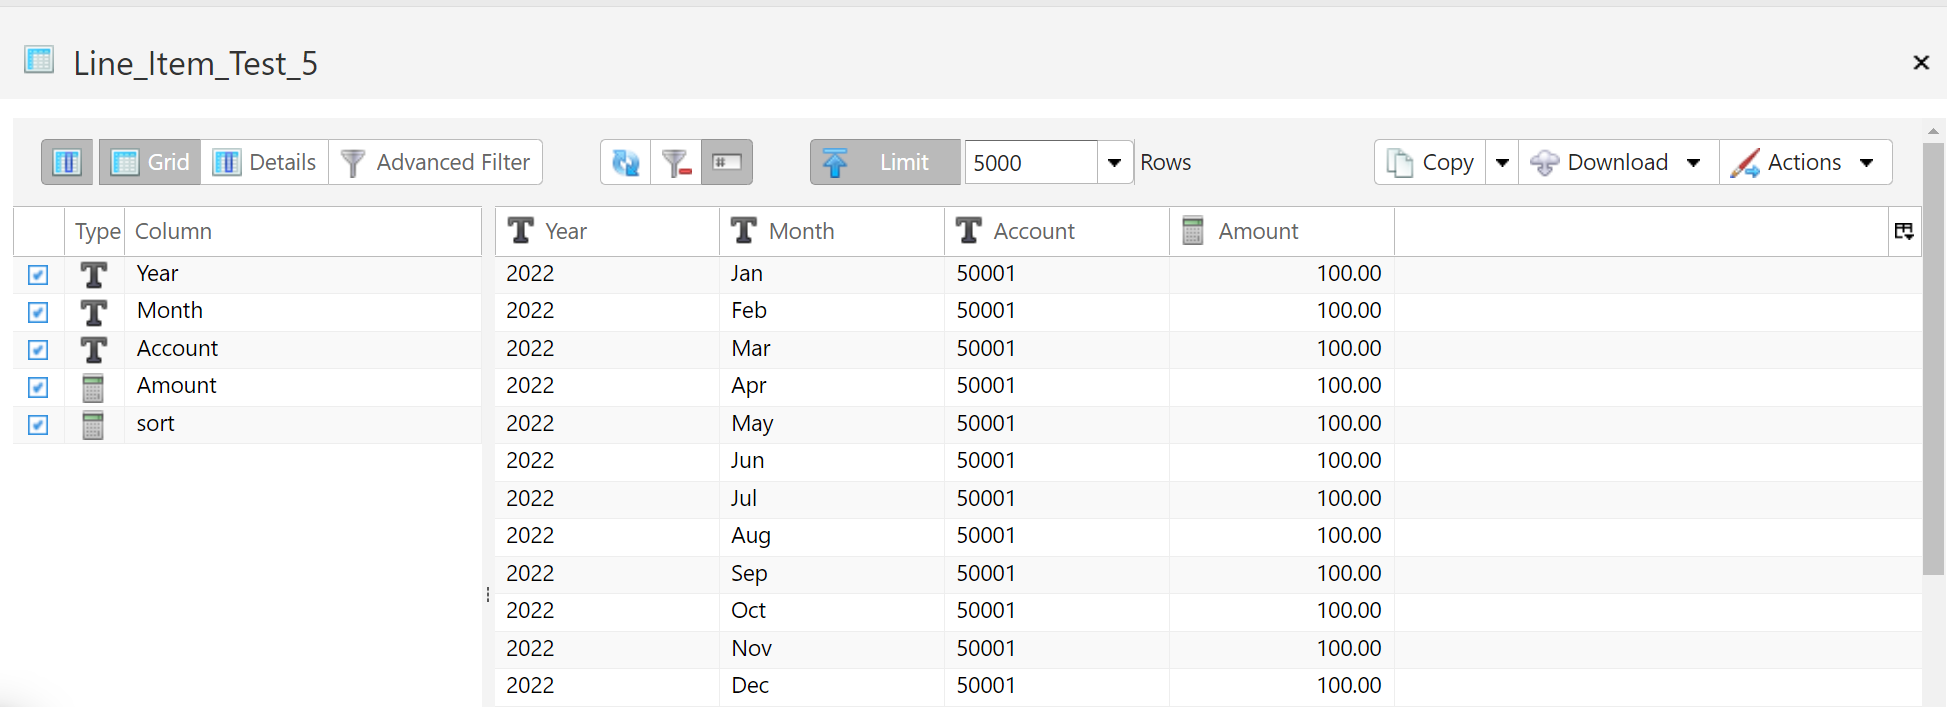
Tagging Result Table
The Tagging Result Table will contain the data from the Source Data Table with the attributes contained in the Assignment Dimension Hierarchy.
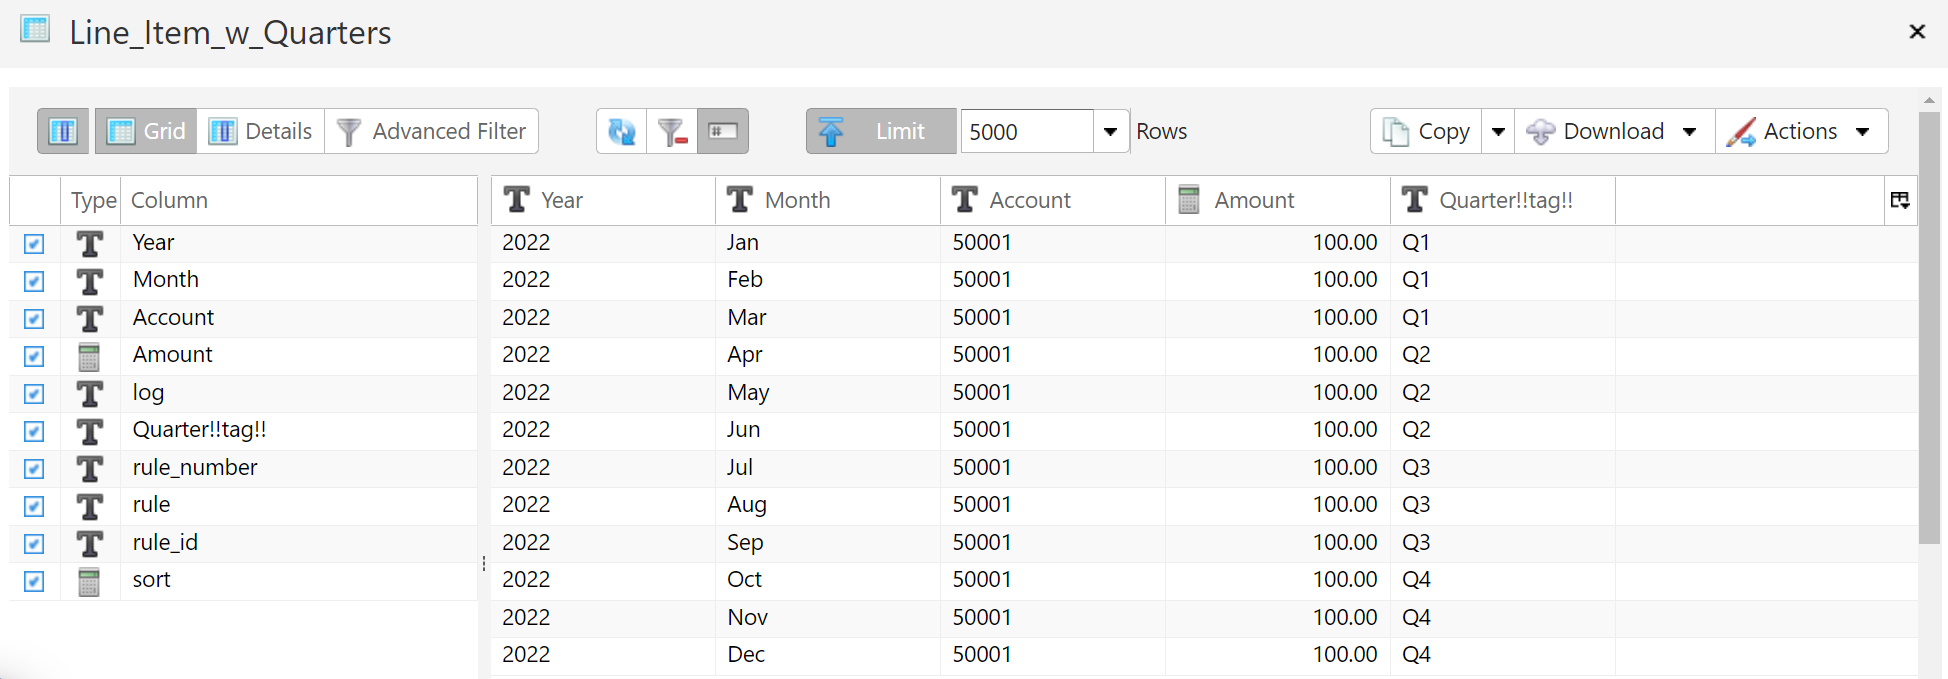
Assignment Dimesion Hierarchy
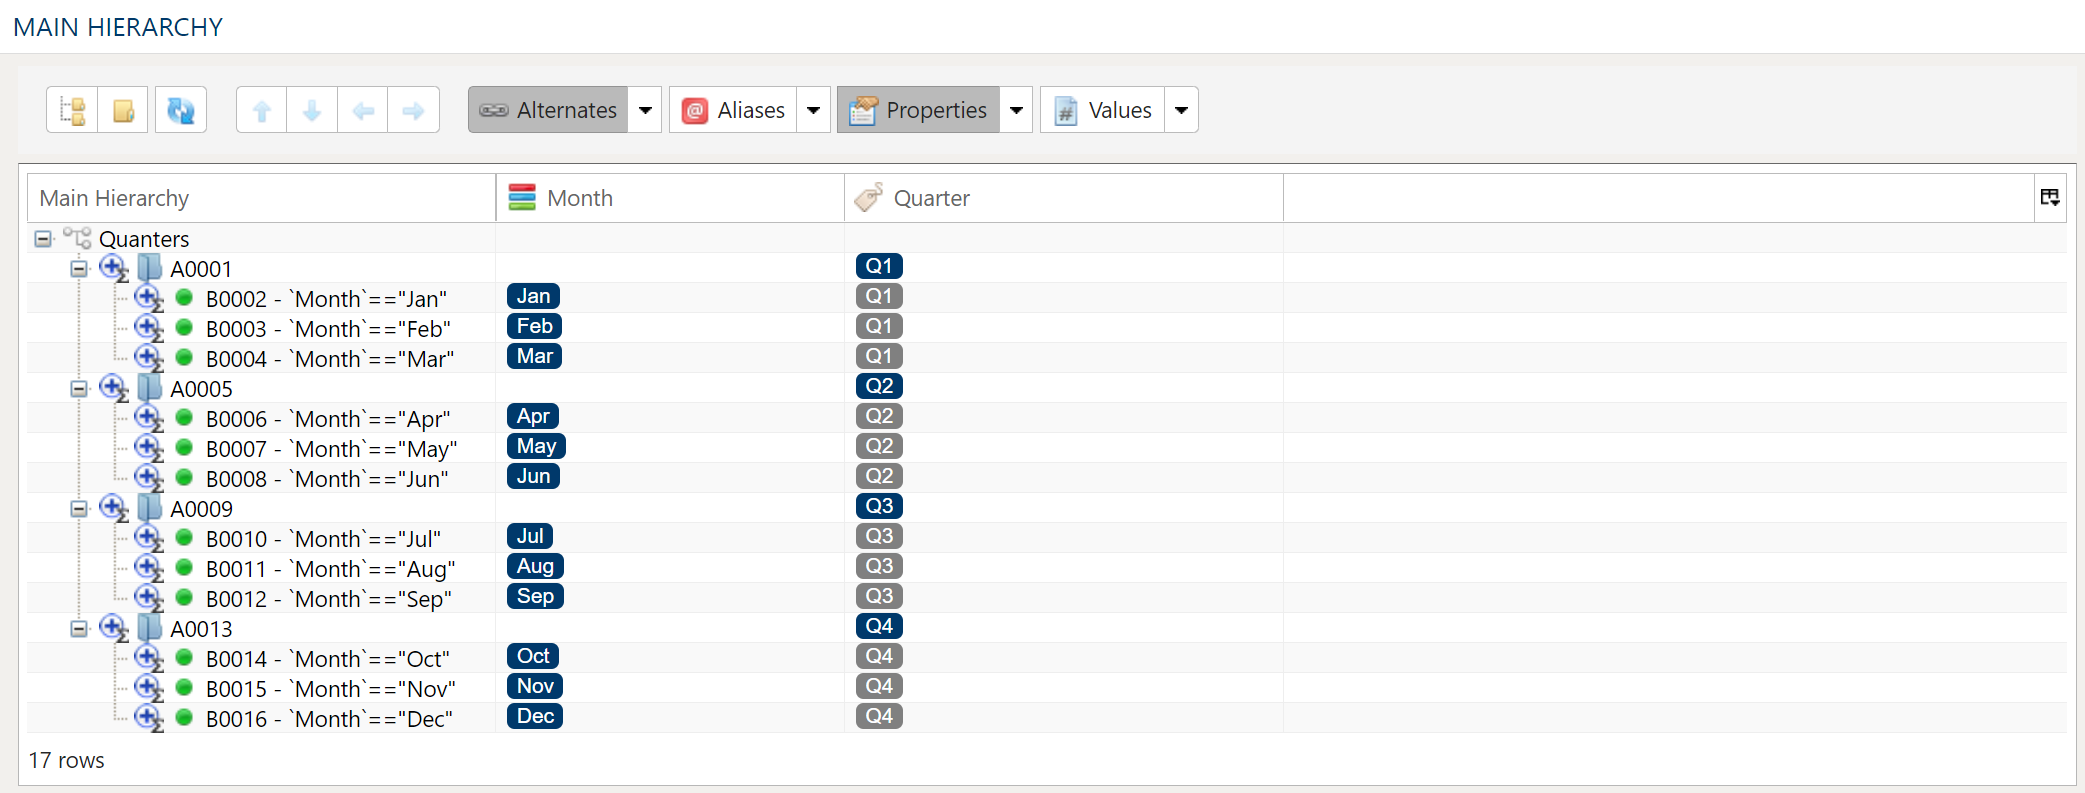
The Assignment Dimension Hierarchy gives the user the ability to point, click and filter the Source Table to add attributes to the Tagging Result Table. The Assignment Dimension Hierarchy is created by combining dimensions that reference the Source Table.
Creating An Assignment Dimension Hierarchy
To create the Assignment Dimension Hierarchy you must first create the dimensions you wish to use to as filters for the Source Table. The links below will guide you through creating these dimensions.
Creating The Main Hierarchy
Once the dimensions for the Source Table have been created the next step is to decide which of the dimensions for the Source Table will serve as the Main Hierarchy for the Assignment Dimension Hierarchy.
Copy this dimension by navigating to the Dimensions tab in PlaidCloud, clicking on the dimension and then selecting Actions and Copy Dimension. When you copy the dimension a pop-up will apprear asking you to enter a name for the copied dimension.
Adding Dimensions To The Assignment Hierarchy
Open the newley created Assignment Dimension, click on the down arrow next to Properties and select New Property.
This will open the Property Configuration dialog box:
Property Configuration
Property Name - This is normally the name of the dimension that is being added to the Assignment Hierarchy.
Property Display - This should be set to "Tag".
Property Type - For Rule Based Tagging property type should be set to Source.
- Source - Is used in conjunction with the Source Table.
Editor Type - This drop down should be set to Select Dimension.
Once the appropriate properties have been selected for the dimension being added to the Assignment Hierarchy select "Edit Configuration".
Dimension Configuration
- Dimension - Use the drop down to select the dimension.
- Hierarchy - If the dimension selected has alternate hierarchies, then they will appear and be selectable here as well as the main hierarchy.
- Start Node - If you don't wish the dimension to be displayed from the top node you can select any node within the hierarchy as the node from which the dimension will be displayed.
- Allow Multiple Selections - If checked the user will be able to select multiple nodes in the hierarchy.
- Special Cases - Are not used in Rule Based Tagging.
Source Map
The Allocation Source Map is used to map the columns from the Values To Allocate Table that will be used in the allocation step.
Inspection and Populating the Mapper
Using the Inspect Source menu button provides additional ways to map columns from source to target:
- Populate Both Mapping Tables: Propagates all values from the source data table into the target data table. This is done by default.
- Populate Source Mapping Table Only: Maps all values in the source data table only. This is helpful when modifying an existing workflow when source column structure has changed.
- Populate Target Mapping Table Only: Propagates all values into the target data table only.
If the source and target column options aren’t enough, other columns can be added into the target data table in several different ways:
- Propagate All will insert all source columns into the target data table, whether they already existed or not.
- Propagate Selected will insert selected source column(s) only.
- Right click on target side and select Insert Row to insert a row immediately above the currently selected row.
- Right click on target side and select Append Row to insert a row at the bottom (far right) of the target data table.
Role
Each column in the data mapper must be assigned a role:
- Pass Thought - These columns will appear in the allocation results table.
- Value to Allocate - This is the column that contains the values to be allocated.
Deleting Columns
To delete columns from the target data table, select the desired column(s), then right click and select Delete.
Chaging Column Order
To rearrange columns in the target data table, select the desired column(s). You can use either:
- Bulk Move Arrows: Select the desired move option from the arrows in the upper right
- Context Menu: Right clikc and select Move to Top, Move Up, Move Down, or Move to Bottom.
Reduce Result to Distinct Records Only
To return only distinct options, select the Distinct menu option. This will toggle a set of checkboxes for each column in the source. Simply check any box next to the corresponding column to return only distinct results.
Depending on the situation, you may want to consider use of Summarization instead.
The distinct process retains the first unique record found and discards the rest. You may want to apply a sort on the data if it is important for consistency between runs.
Aggregation and Grouping
To aggregate results, select the Summarize menu option. This will toggle a set of select boxes for each column in the target data table. Choose an appropriate summarization method for each column.
- Group By
- Sum
- Min
- Max
- First
- Last
- Count
- Count (including nulls)
- Mean
- Standard Deviation
- Sample Standard Deviation
- Population Standard Deviation
- Variance
- Sample Variance
- Population Variance
- Advanced Non-Group_By
For advanced data mapper usage such as expressions, cleaning, and constants, please see the Advanced Data Mapper Usage
Source Filters
To allow for maximum flexibility, data filters are available on the source data and the target data. For larger data sets, it can be especially beneficial to filter out rows on the source so the remaining operations are performed on a smaller data set.
Select Subset Of Data
This filter type provides a way to filter the inbound source data based on the specified conditions.
Apply Secondary Filter To Result Data
This filter type provides a way to apply a filter to the post-transformed result data based on the specified conditions. The ability to apply a filter on the post-transformed result allows for exclusions based on results of complex calcuations, summarizaitons, or window functions.
Final Data Table Slicing (Limit)
The row slicing capability provides the ability to limit the rows in the result set based on a range and starting point.
Filter Syntax
The filter syntax utilizes Python SQLAlchemy which is the same syntax as other expressions.
View examples and expression functions in the Expressions area.
4.15 - SAP ECC and S/4HANA Steps
4.15.1 - Call SAP Financial Document Attachment
Description
Calls an SAP ECC Remote Function Call (RFC) designed to attach a file to specified FI document number.
Examples
RFC Parameters
Select Agent to Use. Select Target Directory from the drop down bar, and browse below for the correct child folder destination for the file. Next, appropriately name the “Target File Name”. Under “Function Call Information”, enter the Function, the Return Value Parameter, and select the parameters.
You can choose to Insert Row or Append Row under the Parameters section, as well as name the parameters and give them values. Choose the Max Concurrent Requests number, and select Wait for RFC to Complete. Save and Run Step.
4.15.2 - Call SAP General Ledger Posting
Description
Calls an SAP ECC Remote Function Call (RFC) designed to post a journal entry including applicable VAT and Withholding taxes. This may also run in test mode which will perform a posting process but not complete the posting. This allows for the collection of detectable errors such as an account being closed or a customer not existing in the specified company code specified. The error checking is robust with the ability to return multiple detected errors in a single test.
Examples
RFC Parameters
Select Agent to Use. Select Target Directory from the drop down bar, and browse below for the correct child folder destination for the file. Next, appropriately name the “Target File Name”. Under “Function Call Information”, enter the Function, the Return Value Parameter, and select the parameters.
You can choose to Insert Row or Append Row under the Parameters section, as well as name the parameters and give them values. Choose the Max Concurrent Requests number, and select Wait for RFC to Complete. Save and Run Step.
4.15.3 - Call SAP Master Data Table RFC
Description
Calls an SAP ECC Remote Function Call (RFC) designed to access master data tables and retrieves the data in tabular form. This data is then available for transformation processes in PlaidCloud. It also provides the ability to export the master data table structure to a separate file which includes column names, data types, and column order information.
Examples
RFC Parameters
Select Agent to Use. Select Target Directory from the drop down bar, and browse below for the correct child folder destination for the file. Next, appropriately name the “Target File Name”. Under “Function Call Information”, enter the Function, the Return Value Parameter, and select the parameters.
You can choose to Insert Row or Append Row under the Parameters section, as well as name the parameters and give them values. Choose the Max Concurrent Requests number, and select Wait for RFC to Complete. Save and Run Step.
4.15.4 - Call SAP RFC
Description
Calls an SAP ECC Remote Function Call (RFC) and retrieves the data in tabular form. This data is then available for transformation processes in PlaidCloud.
Examples
RFC Parameters
Select Agent to Use. Select Target Directory from the drop down bar, and browse below for the correct child folder destination for the file. Next, appropriately name the “Target File Name”. Under “Function Call Information”, enter the Function, the Return Value Parameter, and select the parameters.
You can choose to Insert Row or Append Row under the Parameters section, as well as name the parameters and give them values. Choose the Max Concurrent Requests number, and select Wait for RFC to Complete. Save and Run Step.
Advanced Value Iteration
You can select “No Iterators” at the top of this tab and then select Save and Run Step if desired, or you can specify.
Here, you can select “Specify Argument Values” to Iterate Over and create arguments to then go to the Iteration Value.
Next to Select Iterator Argument to Edit Values, there is the option to Insert Tow, Append Row, Delete Row, Move Down Row, or Move to Bottom Row. Below you can choose Range Iterators using the same drop down menu. The last section is titled “Exclusions for Selected Range Iteration” with the same options per row to add, delete, etc. The excluded values can be entered below. Save and Run Step.
4.16 - SAP PCM Steps
4.16.1 - Create SAP PCM Model
Description
Creates a blank SAP Profitability and Cost Management (PCM) model.
Our Credentials
Tartan Solutions is an official SAP Partner and a preferred vendor of services related to SAP PCM model design and implementation.
Examples
Select Agent to Use from the dropdown. Enter “Model Name” and select “Model type” from the dropdown (both of which are in the “Model Information” section). Check the “Wait for Copy to Complete” check box, then click “Save and Run Step”.
4.16.2 - Delete SAP PCM Model
Description
Deletes SAP Profitability and Cost Management (PCM) models matching the search criteria. Deleting models using this transform allows deletion of many models without having to monitor the process.
Our Credentials
Tartan Solutions is an official SAP Partner and a preferred vendor of services related to SAP PCM model design and implementation.
Examples
Select “Agent to Use” from the dropdown. Select your desired “Model Search Method”. For this example, we’ve selected “Exact Match”. Enter “Model Search Text” (what you are looking for) under “Model Name Information” and decide if the search is case sensitive or not (if so, check the check box). Finally, check the “Wait for Deletion to Complete” and click “Save and Run Step”.
4.16.3 - Calculate PCM Model
Description
Starts SAP Profitability and Cost Management (PCM) model calculation process.
Our Credentials
Tartan Solutions is an official SAP Partner and a preferred vendor of services related to SAP PCM model design and implementation.
Examples
Select Agent to Use from the dropdown, enter model name in the “Model Name” field, click the “Wait for Calculation to Complete” check box (if desired), then click “Save and Run Step”.
4.16.4 - Copy SAP PCM Model
Description
Copies an SAP Profitability and Cost Management (PCM) model.
Our Credentials
Tartan Solutions is an official SAP Partner and a preferred vendor of services related to SAP PCM model design and implementation.
Example
Select Agent to Use from the dropdown, enter “From Model Name” and “To Model Name” in the “Model Information” field, click the “Wait for Copy to Complete” check box, then click “Save and Run Step”.
4.16.5 - Copy SAP PCM Period
Description
Copies an SAP Profitability and Cost Management (PCM) model period within the same model.
Our Credentials
Tartan Solutions is an official SAP Partner and a preferred vendor of services related to SAP PCM model design and implementation.
Examples
Select Agent to Use from the dropdown, enter “Model Name”, “From Period Name” and “To Period Name” in the “Model Information” field. Click the “Wait for Copy to Complete” check box, then click “Save and Run Step”.
4.16.6 - Copy SAP PCM Version
Description
Copies an SAP Profitability and Cost Management (PCM) model version within the same model.
Our Credentials
Tartan Solutions is an official SAP Partner and a preferred vendor of services related to SAP PCM model design and implementation.
Examples
Select Agent to Use from the dropdown, enter “Model Name”, “Origin Period Name”, and “Destination Period Name” in the “Model Information” field. Click the “Wait for Copy to Complete” check box, then click “Save and Run Step”.
4.16.7 - Rename SAP PCM Model
Description
Renames an SAP Profitability and Cost Management (PCM) model.
Our Credentials
Tartan Solutions is an official SAP Partner and a preferred vendor of services related to SAP PCM model design and implementation.
Examples
Select Agent to Use from the dropdown, enter “From Model Name” and “To Model Name” in the “Model Information” field, click the “Wait for Copy to Complete” check box, then click “Save and Run Step”.
4.16.8 - Run SAP PCM Console Job
Description
Launches an SAP Profitability and Cost Management (PCM) Console process on the PCM server.
Our Credentials
Tartan Solutions is an official SAP Partner and a preferred vendor of services related to SAP PCM model design and implementation.
Examples
Select Agent to Use from the dropdown, enter console file path in the “Console File Path” field, click the “Wait for Console Job to Complete” check box (if desired), then click “Save and Run Step”.
4.16.9 - Run SAP PCM Hyper Loader
Description
Loads an SAP Profitability and Cost Management (PCM) model using direct table loads. This process is significantly faster than Databridge. The Hyper Loader supports virtually all of the current PCM data, assignment, and structure tables.
This is the current list of available loading targets:
- Activity Aliases
- Activity Dimensional Hierarchy
- Activity Driver Aliases
- Activity Driver Dimensional Hierarchy
- Activity Driver Value
- BOM Default Makeup
- BOM External Unit Rate
- BOM Makeup
- BOM Production Volume
- BOM Units Sold
- Cost Object 1 Aliases
- Cost Object 1 Dimensional Hierarchy
- Cost Object 2 Aliases
- Cost Object 2 Dimensional Hierarchy
- Cost Object 3 Aliases
- Cost Object 3 Dimensional Hierarchy
- Cost Object 4 Aliases
- Cost Object 4 Dimensional Hierarchy
- Cost Object 5 Aliases
- Cost Object 5 Dimensional Hierarchy
- Cost Object Assignment
- Cost Object Driver
- Line Item Aliases
- Line Item Detail Aliases
- Line Item Detail Dimensional Hierarchy
- Line Item Detail Value
- Line Item Dimensional Hierarchy
- Line Item Direct Activity Assignment
- Line Item Resource Driver Assignment
- Line Item Value
- Period Aliases
- Period Dimensional Hierarchy
- Resource Driver Aliases
- Resource Driver Dimensional Hierarchy
- Resource Driver Split
- Resource Driver Value
- Responsibility Center Aliases
- Responsibility Center Dimensional Hierarchy
- Revenue
- Revenue Aliases
- Revenue Dimensional Hierarchy
- Service Aliases
- Service Dimensional Hierarchy
- Spread Aliases
- Spread Dimensional Hierarchy
- Spread Value
- Version Aliases
- Version Dimensional Hierarchy
- Worksheet 1 Aliases
- Worksheet 1 Dimensional Hierarchy
- Worksheet 2 Aliases
- Worksheet 2 Dimensional Hierarchy
- Worksheet Value
Our Credentials
Tartan Solutions is an official SAP Partner and a preferred vendor of services related to SAP PCM model design and implementation.
Examples
Select Agent to Use from the dropdown. Enter model name and select the load package storage path location, then select the child folder desired from within. Use the Table Data Selection below to select the source table model and the target load table. Inspect source>>propagate both sides of the table will reveal the data. Click “Save and Run Step” when the data is entered and you have added any expressions.
4.16.10 - Stop PCM Model Calculation
Description
Stops an SAP Profitability and Cost Management (PCM) model calculation process.
Our Credentials
Tartan Solutions is an official SAP Partner and a preferred vendor of services related to SAP PCM model design and implementation.
Examples
Select Agent to Use from the dropdown, enter “Model Name”, click the “Wait for Copy to Complete” check box, then click “Save and Run Step”.
5 - Scheduled Workflows
5.1 - Event Scheduler
Description
Scheduling specific workflows can be a useful organization tool, so PlaidCloud provides the ability to do just that. Using event scheduler, you can schedule a workflow to run by month, day, hour, minute, or even on a financial workday schedule. If using the financial workday schedule approach, PlaidCloud also allows configuration of holiday schedules using various holiday calendars.
The Events Table will indicate whether the event is scheduled by month, day, hour and minute, or workday under the event description column.
To view events:
- Open Analyze
- Select “Tools”
- Click “Event Scheduler”
This will open the Events Table showing all the current events configured for the workspace.
Creating an Event
To create an event:
- Open Analyze
- Select “Tools”
- Click “Event Scheduler”
- Click “Add Scheduled Event”
- Complete the required fields
- Click “create”
Limit Running: this section allows you to schedule an event to run for a specific time period and a specific number of times.
Otherwise, you can set the workflow to run using the classic schedule approach.
To use the classic schedule approach:
- Click the “Event Schedule” tab of the Event table
- Under the “Schedule type” select “Use Classic Schedule”
- Select the specific months, hours, minutes, and days you want the workflow to run
To set the workflow to run using the workday schedule approach:
- Click the “Event Schedule” tab of the Event table
- Under the “Schedule type” select “Use Workday Schedule”
- Choose the workday you would like the workflow to run on
Editing an Event
To edit an event:
- Open Analyze
- Select “Tools”
- Click “Event Scheduler”
- Click the edit icon
- Adjust desired fields
- Click “Update”
Deleting an Event
To delete an event:
- Open Analyze
- Select “Tools”
- Click “Event Scheduler”
- Click the delete icon
- Click delete again
Pausing an Event
To temporarily pause an event:
- Open Analyze
- Select “Tools”
- Click “Event Scheduler”
- Click the edit icon
- Uncheck the “Active” checkbox
- Click “Update”
Saving the event after unchecking the active box means the event will no longer run on the specified schedule until it’s reactivated.
Running Events on Demand
To run an event immediately:
- Open Analyze
- Select “Tools”
- Click “Event Scheduler”
- Select the desired event or events
- Click “Run Selected Events”
6 - External Data Source and Service Connectors
6.1 - Data Connections
Description
PlaidCloud connects to external systems by using various data connections directly or through PlaidLink agents.
For more details on each data connection type, please navigate to the specific data connection documentation.
Relational Databases
Greenplum
| Parameter | Value |
|---|---|
| Connection Type | Database |
| Reference | greenplum |
Microsoft SQL Server
| Parameter | Value |
|---|---|
| Connection Type | Database |
| Reference | sqlserver |
MySQL
| Parameter | Value |
|---|---|
| Connection Type | Database |
| Reference | mysql |
ODBC
| Parameter | Value |
|---|---|
| Connection Type | Database |
| Reference | odbc |
Oracle
| Parameter | Value |
|---|---|
| Connection Type | Database |
| Reference | oracle |
Postgres
| Parameter | Value |
|---|---|
| Connection Type | Database |
| Reference | postgres |
Amazon Redshift
| Parameter | Value |
|---|---|
| Connection Type | Database |
| Reference | redshift |
SAP HANA
| Parameter | Value |
|---|---|
| Connection Type | Database |
| Reference | hana |
Exasol
| Parameter | Value |
|---|---|
| Connection Type | Database |
| Reference | exasol |
IBM DB2
| Parameter | Value |
|---|---|
| Connection Type | Database |
| Reference | db2 |
Informix
| Parameter | Value |
|---|---|
| Connection Type | Database |
| Reference | informix |
Hadoop Based Databases
Hive
| Parameter | Value |
|---|---|
| Connection Type | Database |
| Reference | hive |
Presto
| Parameter | Value |
|---|---|
| Connection Type | Database |
| Reference | presto |
Spark
| Parameter | Value |
|---|---|
| Connection Type | Database |
| Reference | spark |
Team Collaboration Tools
Microsoft Teams
| Parameter | Value |
|---|---|
| Connection Type | Notification |
| Reference | teams |
Slack
| Parameter | Value |
|---|---|
| Connection Type | Notification |
| Reference | slack |
Cloud Services
OAuth Connection
| Parameter | Value |
|---|---|
| Connection Type | oAuth |
| Reference | oauth |
Quandl
| Parameter | Value |
|---|---|
| Connection Type | Quandl |
| Reference | quandl |
Google Related
Google Big Query
| Parameter | Value |
|---|---|
| Connection Type | Google Big Query |
| Reference | gbq |
Google Spreadsheet
| Parameter | Value |
|---|---|
| Connection Type | Google Spreadsheet |
| Reference | gspread |
Oracle EBS Related
Oracle EBS utilizes the standard Oracle database connection specified above. This connection provides the connectivity to query, load, and execute PL/SQL programs in Oracle.
If the EBS instance has the REST API interface available, this can be accessed using the same approach as Oracle Cloud described below.
Oracle Cloud Related
Oracle Cloud utilizes standard RESTful requests to perform queries, data loading, and other operations. A REST connection using OAuth2 tokens is used for these interactions. This uses the standard oAuth connection specified above.
Salesforce Related
Salesforce utilizes standard RESTful requests to perform all operations. A REST connection using OAuth2 tokens is used for these interactions. This uses the Salesforce specific connection type.
Workday Related
Workday utilizes standard RESTful requests to perform all operations. A REST connection using OAuth2 tokens is used for these interactions. This uses the standard oAuth connection specified above.
JD Edwards Legacy Version Related
| Parameter | Value |
|---|---|
| Connection Type | JD Edwards Legacy |
| Reference | jde_legacy |
JD Edwards Related
JD Edwards utilizes the standard Oracle database connection specified above. This connection provides the connectivity to query, load, and execute PL/SQL programs in Oracle.
Infor Related
| Parameter | Value |
|---|---|
| Connection Type | Infor |
| Reference | infor |
SAP Related
SAP Analytics Cloud
| Parameter | Value |
|---|---|
| Connection Type | SAP Analytics Cloud |
| Reference | sap_sac |
SAP ECC
| Parameter | Value |
|---|---|
| Connection Type | SAP ECC |
| Reference | sap_ecc |
SAP Profitability and Cost Management (PCM)
| Parameter | Value |
|---|---|
| Connection Type | SAP PCM |
| Reference | sap_pcm |
SAP Profitability and Performance Management (PaPM)
| Parameter | Value |
|---|---|
| Connection Type | SAP PaPM |
| Reference | sap_papm |
7 - Allocation Assignments
7.1 - Getting Started
7.1.1 - Allocations Quick Start
Content coming soon...
7.1.2 - Why are Allocations Useful
Content coming soon...
7.2 - Configure Allocations
7.2.1 - Configure an Allocation
Purpose
Allocations enable values (typically costs) to be shredded to a more-granular level by applying a driver. Allocations are used to for a multitude of purposes. including but not limited to Activity-Based Costing, IT & Shared Service Chargeback, calculation of fully loaded cost to produce and provide a good or service to customers, etc. They are a fundamental tool for financial analysis, and a cornerstone for managerial reporting operations such as Customer & Product Profitability. They are also a useful construct for establishing and managing global Intercompany Transfer Prices for goods and services.
Setting up the Allocation transform
From a practical purpose, allocations are set up in PlaidCloud in similar fashion as other data transforms such as joins and lookups. Four configuration parameters must be set in order for an Allocation transform to succeed.
- Specify Preallocated Data: Specify the preallocated data table in the Values To Allocate Table section of the allocation transform.
- Specify Driver Data: Driver data will serve as the basis for the ratios used in the allocation. Choose the driver data table in the Driver Data Table section of the allocation transform.
- Specify the Results Table: Post-allocated data must be stored in a table. Specify the table in the Allocation Result Table section of the allocation result section of the transform.
- Specify the Assignment Dimension: Allocations require an assignment dimension, whose purpose is to provide the prescription for how each record or set of records in the preallocated will be assigned. Specify the the assignment dimension in the Assignment Dimension Hierarchy section of the allocation transform.
Key Concepts
The sum of values in an allocated dataset should tie out to those of the pre-allocated source data
Allocations are accessible in PlaidCloud as a transform option. To set up an allocation, first, set up assignments, and then configure an allocation transform to use the assignments to allocate inbound records using a specified driver table.
Assignments are special dimensions. They are accessed within the Dimensions section of a PlaidCloud Project.
To set up an assignment dimension, perform the following steps:
- From the project screen, Navigate to the Dimensions tab
- Create a new dimension
7.2.2 - Recursive Allocations
Content coming soon...
7.3 - Results and Troubleshooting
7.3.1 - Allocation Results
Content coming soon...
7.3.2 - Troubleshooting Allocations
Stranded Cost
Stranded cost is....
Over Allocation of Cost
Over allocation of cost is when you end up with more output cost...
Incorrect Allocation of Cost
Incorrect allocation of costs happens when...
8 - Data Warehouse Service
8.1 - Getting Started
About
The PlaidCloud Data Warehouse Service (DWS) stands on the shoulders of great technology. The service is based on Greenplum, a warehouse suitable for big data analytics and traditional data warehouse operations. It's extensive analytical optimizations, array of indexing types, highly-flexible compression, and availability of both row-based and columnar storage models makes it ideal for wide array of uses.
The PlaidCloud DWS continues our goal of providing the best open source options for our customers to eliminate lock-in while also providing services as turn-key solutions.
Managing, upgrading, and maintaining a data warehouse requires special skills and investment. Both can be hard to find when you need them. The PlaidCloud service eliminates that need while still providing deep technical access for those that need or want total control. Since Greenplum is based on PostgreSQL, it is nearly 100% compatible with current PostgreSQL operations.
Key Benefits
Always on
The PlaidCloud DWS provides always-on query access. You don't have to schedule availability or incur additional costs for usage outside the expected time.
This also means there is no first-query delay and no cache to warm up before optimal performance is achieved.
Read and Write the way you expect
The PlaidCloud DWS operates like a traditional database so you don't have to decide which instances are read-only or have special processes to load data from a write instance. All instances support full read and write with no special ETL or data loading processes required.
If you are used to using traditional databases, you don't need to learn any new skills or change your applications. The DWS is a drop-in replacement for Greenplum as well as a replacement for PostgreSQL, CockroachDB, yugabyteDB and other databases that use the PostgreSQL Wire Protocol. If you are coming from other databases such as Oracle, MySQL or Microsoft SQL Server then some adjustments to your query logic may be necessary but not to the overall process.
Since SAP HANA and Amazon Redshift use the PostgreSQL dialect, those seeking a portable alternative will find PlaidCloud DWS a straightforward option.
Economical
With usage based billing, you only pay for what you use. There are no per-query or extra processing charges. High performance storage with triple redundancy, incredible IOPS, wide data throughput, and out-of-band backups are all standard at a reasonable price.
We eliminate the headache of having to choose different data warehousing tiers based on optimizing storage costs. We offer three different storage options at a table level which all interoperate and can be used together in queries:
- HOT - This is the highest performance storage available and is suitable for analytical data that is frequently accessed or needs to be ultra-responsive
- WARM - This provides cost savings over Hot storage while maintaining good performance and no changes to SQL commands
- COLD - This is the most economical by utilizing cloud storage
Highly performant
While network attached storage has been able to achieve significant performance, it still can't come close to local disk. Using local disks for storage is complicated while operating in cloud environments but our goal was to provide an uncompromising data warehouse service that can achieve the same or better performance as a hand-built data warehouse cluster.
We also extensively tested optimal compute, networking, and RAM configurations to achieve maximum performance. As new technology and capabilities become available, our goal is to incorporate features that increase performance.
Real-time backups without impacting performance
One of the more complex processes with data warehouse clusters is backups. While seemingly simple, achieving a consistent snapshot of data across many nodes while not interfering in the execution of multiple queries is actually quite complex. Doing this without impacting performance of the database is even harder.
Thankfully, you don't have to worry about all that complexity. You can set the frequency of backups you desire and it is all handled automatically for you. While all data is triple redundant, backups are necessary in the event a destructive user action takes place such as accidentally deleting data or dropping a table. Having a backup allows for recovery of that prior state.
Scale out and scale up capable
The ability to both scale up and scale out are essential for a data warehouse, especially when it is performing analytical processes.
Scaling up means more simultaneous queries can occur at once. This is useful if you have many users or applications that require many concurrent processes.
Scaling out means more compute power can be applied to each query by breaking the data processing up across many CPUs. This is useful on large data where summarizations or other analytical processes such as machine learning (MADLib) or geospatial (PostGIS) analysis is required.
The PlaidCloud DWS allows scale expansion either on-demand or based on pre-defined events/metrics.
Integrated with PlaidCloud Analyze for Low/No Code operations
Analyze and Dashboards are quickly connected to any PlaidCloud DWS. This provides point-and-click operations to automate data related activities as well as building beautiful visualizations for reporting and insightful analysis.
From an Analyze project, you can select any DWS instance. This also provides the ability for Analyze projects to switch among DWS instances to facilitate testing and Blue/Green upgrade processes. It also allows quickly restoring an Analyze Project from a DWS point-in-time backup.
Clone
Making a clone of an existing warehouse performs a complete copy of the source warehouse. When a clone is made it has nothing shared with the original warehouse and therefore is a quick way to isolate a complete warehouse for testing or even a live archive at a specific point in time.
Another important feature is that you can clone a warehouse to a different data center. This might be desireable if global usage shifts from one region to another or having a copy of a warehouse in various regions for development/testing improves internal processes.
Restore
A new warehouse instance is easily restored from an existing backup. The backup frequency is adjustable for each warehouse instance. Those backups allow for a point-in-time restoration.
Prioritize queries within the warehouse
The PlaidCloud DWS provides a straightforward way to control the priority of queries within a single DWS instance. Through use of Resource Queues, certain roles can be granted higher priority. This differs from other warehouse services that require separate warehouse instances to delineate different priority access based on resource isolation/dedication.
By using Resource Queues, you can achieve your business requirements (e.g. high priority dashboards for executives) while using a single DWS instance. This allows you to control resource usage and eliminates the need to have large amounts of idle resources dedicated to low usage (high importance) scenarios.
Large number of connectors available
Since PlaidCloud DWS is based on PostgreSQL technology, virtually all PostgreSQL connectors and clients will work out-of-the-box. With a vibrant PostgreSQL community, new capabilities, adapters, and connectors are released frequently.
Some examples:
- Integration with Microsoft PowerBI using the NpgSQL built-in connector
- Connect Tableau using the standard data source setup for PostgreSQL connections
- Apache Superset integration using PostgreSQL connection string
- Qlik integration using the PosgreSQL Connector Package
Foreign table access
Already have data in another database or in cloud storage? No worry, you can connect to it directly and include the data in complex queries such as joins and Common Table Expressions. Use of foreign tables also include predicate push-down so conditions are applied before the data is moved to the DWS instance.
This enables use of existing data sources which means you can choose to gradually migrate them to a DWS instance or choose to keep the data where it exists forever.
Note that performance will not be as good as having the data in the DWS instance since it is subject to network speeds and the speed of the foreign data source operations.
This capability also enables communication across different PlaidCloud DWS instances. While it would be ideal to have all data in a single warehouse instance, there are certainly situations where this is not always practical.
Well understood and mature
While much of data warehousing activity is fairly straightforward, there still remains a large body of work that pushes the bounds of a database. When operating at maximum capacity, many facets come into play including the maturity and optimization of all the underlying processes. Since PlaidCloud DWS is built on very mature technology in use for decades, substantial performance and stability optimizations are in place.
With a well understood and mature technical foundation, there is a far less likelihood of strange failure modes and when unusual events do occur an answer is likely a Google search away.
Tuning queries is sometimes necessary for highly complex queries. There are substantial resources available that help explain, analyze, and optimize queries in PostgreSQL and Greenplum systems. We all wish that the days of hand tuning queries were no longer necessary. The questions we ask of our data and required processing to determine a result can often have orders of magnitude time improvements by adjusting aspects of the query where even the most intelligent query planner will struggle.
When trying to squeeze out the best performance you want to rely on known patterns and examples.
Web or Desktop SQL Client Access
A web SQL console is provided within PlaidCloud. It is a full featured SQL client so it supports most use cases. However, for more advanced use cases, a desktop client or other service may be desired. The PlaidCloud DWS uses standard security and access controls enabling remote connections and controlled user permissions.
Access options allow quick and easy start-up as well as ongoing query and analytics access. A firewall allows control over external access.
DBeaver provides a nice free desktop option that has a Greenplum driver to fully support PlaidCloud DWS instances. They also provide a commercial version called DBeaver Pro for those that require/prefer use of licensed software.
8.2 - Pricing
Usage Based
The cost of a PlaidCloud Data Warehouse instance is determined by a limited number of factors that you control. All costs incurred are usage based.
The factors that impact cost are:
- Concurrency Factor - The size of each compute node in your warehouse instance
- Parallelism Factor - The number of nodes in your warehouse instance
- Allocated Storage - The number of Gigabytes of storage consumed by your warehouse instance
- Network Egress - The number of Gigabytes of network egress. Excludes traffic to PlaidCloud applications within the same region. Ingress is always free.
- Backup Retention Period - How many days, weeks, or months to retain backups beyond 30 days
Storage, backups, and network egress are calculated in gigabytes (GB), where 1 GB is 2^30 bytes. This unit of measurement is also known as a gibibyte (GiB).
All prices are in USD. If you are paying in another currency please convert to your currency using the appropriate rate.
Billing is on an hourly basis. The monthly prices shown are illustrative based on a 730 hour month.
Controlling Factors
Concurrency Factor
| Compute Type | Hourly Cost (streams/hr) | Monthly Cost (streams/month) |
|---|---|---|
| Standard | Contact Us | Contact Us |
Concurrency determines how many simultaneous queries are handled by the DWS instance. This is expressed as a number of process streams. There is not a 1:1 relationship between streams and query capacity since a single stream can handle multiple simultaneous queries. However, as the number of concurrent requests increase, the query duration may exceed the desired response time and an increase in the concurrency factor will help.
From a conceptual standpoint you can view processing streams as vCPUs used to process queries.
The default concurrency factor is 2, which is a good starting point if you are unsure of your needs. It can be adjusted from 1 to 14. If your needs exceed 14, please contact us to increase your concurrency limit.
Parallelism Factor
There is no additional cost per node. The compute cost of the DWS instance is the product of concurrency and parallelism plus the master node.
Parallelism determines how many nodes are in the DWS instance. This is expressed as node count. The number of nodes determines how much compute power can be applied to any single query. By increasing the node count, the computational part of the query can be spread out over many process streams. In addition, the storage throughput is multiplied by the number of nodes, which is very valuable when dealing with large datasets.
For example, if the maximum theoretical write throughput of a single node was 4 TB/sec, a warehouse with 8 nodes would have a theoretical write throughput of 8 x 4 TB/sec = 32 TB/sec. There are many factors that impact write speed including compression level, indexes, table storage type, network overhead, etc... but in general, nodes apply a multiplying factor to data throughput speed.
Allocated Storage
Three types of table storage options are available in a PlaidCloud DWS:
- Hot
- Warm
- Cold
| Storage Type | Hourly Cost (GB/hr) | Monthly Cost (GB/month) |
|---|---|---|
| Hot | Contact Us | Contact Us |
| Warm | Contact Us | Contact Us |
| Cold | Contact Us | Contact Us |
These storage options can be applied on a table-by-table basis so you can optimize storage costs within a DWS with no change to existing queries.
Hot Storage
This is the most common storage type for a database. It is the default storage type for data in the DWS instance.
Storage cost is computed based on the allocated Hot storage space for the warehouse instance. Storage is allocated to the warehouse on-demand up to the specified limit set by you. The current limit is 4.5TB per node. If your needs exceed 4.5TB per node, please contact us to increase your node storage limit.
Warm Storage
Warm Storage provides an excellent trade-off between cost and performance. Warm storage is ideal for data used in batch processing, infrequently accessed historical data, or other general data that does not have high performance requirements. Warm storage provides good performance and does not have per node size limits.
Cold Storage
Cold storage is significantly less expensive than both Hot and Warm but it does have limitations. It is not included in the backup snapshots. It has significantly lower performance and is generally not suitable for queries that must be responsive.
However, for low usage or archival data it can provide a substantial cost savings while still enabling real-time access to the data, albeit at a slower query speed. This is a significant improvement over using ETL processes to archive table data and then needing to reconstitute it later when required through additional ETL processes.
For example, if the current and prior year financial data is stored in high performance storage to handle the vast majority of queries, prior years could be stored in Cold storage. When access to several years is needed, exceeding what is in hot storage, then a simple UNION query of the hot data and the cold data will return the full dataset. This eliminates complex data archival processes by keeping all the data readily available in the same DWS instance while optimizing storage costs.
Network Egress
| Source Geolocation | Egress (per GB) | Ingress (per GB) |
|---|---|---|
| Worldwide Locations (Default) | $0.13 | Free |
| China Locations (excluding Hong Kong) | $0.26 | Free |
| Australia Locations | $0.20 | Free |
Network egress is calculated based on the egress traffic from your PlaidCloud Workspace. In terms of the egress traffic from a DWS instance, traffic to PlaidCloud applications in the same region such as Analyze and Dashboard are excluded. However, if you are connecting directly to the DWS instance through the external access point, egress charges will apply. In addition, if you access DWS instances from different regions using PlaidCloud applications then egress charges will apply.
If you connect between DWS instances in the same region using internal network routing there are no egress charges. However, if you connect using the external endpoint then egress charges will apply.
There is no charge for ingress traffic.
Backup Retention Period
| Retention Period | Hourly Cost (GB/hr) | Monthly Cost (GB/month) |
|---|---|---|
| Scheduled Backups - First 30 Days | Free | Free |
| Scheduled Backups - Retention (after 30 days) | $0.000274 | $0.02 |
| On-Demand Backup Snapshots | $0.000274 | $0.02 |
By default, all scheduled backups are stored for 30 days free of charge. Setting the retention period beyond 30 days will incur additional storage retention charges. Backup retention storage cost is based on the allocated storage size of the DWS instance when the backup was taken and the duration for which you would like to retain each backup beyond 30 days.
For example, if the DWS instance allocated storage is 200GB and the additional retention period is 7 days, the backup storage cost is computed as 200GB x 7 Days = 1,400 GB Days.
1,400 GB days x 24 hours/day x $0.000274 per GB/hr = $9.20
On-demand backups can be taken at any time and will incur backup storage fees immediately. There is a minimum of 30 days billing applied to on-demand backups even if they are deleted within the 30 days.
By default, on-demand backups do not have a retention period set. If you make on-demand backups without a retention period, you must manually delete the backup or backup storage fees will continue to accrue.
If you put a hold on a backup to prevent deletion when the retention period expires, you must remove that hold or manually delete the backup. If the hold remains you will continue to incur backup storage fees.
Premium Capabilities Included
PlaidCloud DWS provides several additional features as part of each DWS instance that provide valuable capabilities without additional fees. Each DWS instance includes MADLib, PostGIS, and PXF.
The MADLib and PostGIS libraries allow you to perform machine learning and geospatial analysis without moving your data or using other external tools. PXF provides the ability to query external data files, whose metadata is not managed by the database. PXF includes built-in connectors for accessing data that exists inside HDFS files, Hive tables, HBase tables, JDBC-accessible databases and more. Users can also create their own connectors to other data storage or processing engines.
8.3 - Greenplum Technical Resource Links
Greenplum Introductory Videos
Greenplum Tutorial for Beginners
Greenplum Technical Fundamentals
Greenplum Advanced Usage Concepts
Data Warehouse Modernization with Greenplum
Use of Greenplum with External Tables
Using Greenplum as a Consolidated Data Lake for Analytics
Greenplum Storage Considerations
Understanding Data Distribution in Greenplum